
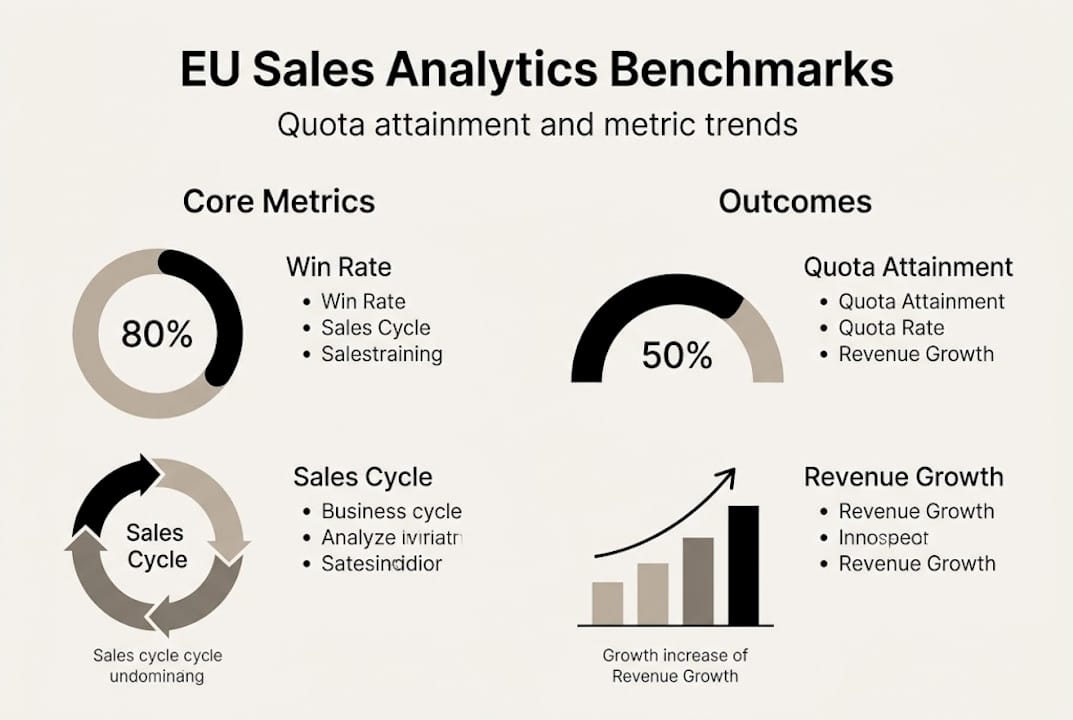
Sales analytics value for EU enterprises: 31% quota attainment
TL;DR:
- Sales analytics provides actionable insights to improve revenue and address pipeline issues in EU enterprises.
- Key metrics include win rate, sales cycle length, pipeline coverage, and forecast accuracy.
- Successful implementation requires clear metrics definition, data validation, team training, and integrating analytics into daily routines.
Most EU enterprise sales teams are busy. Reps are making calls, sending emails, running demos, and filling up CRMs with activity data. Yet enterprise quota attainment averages only 31%, which means nearly seven out of ten reps miss target. That’s not a motivation problem. That’s a visibility problem. When you’re flying blind on what’s actually driving revenue, more activity just means more noise. Sales analytics changes that equation entirely. In this article, we’ll walk you through what sales analytics is, which metrics matter most for EU enterprises, how to turn data into revenue actions, and how to avoid the pitfalls that trip up most implementations.
| Point | Details |
|---|---|
| Metrics that matter | Tracking win rate, pipeline coverage, and forecast accuracy is essential for EU sales leaders. |
| Benchmarks reveal gaps | Comparing your numbers with enterprise medians highlights improvement opportunities. |
| Analytics drive results | Data-driven decision-making leads to faster sales cycles, higher win rates, and better coaching. |
| Cultural change first | Success with analytics depends on integrating learnings into your sales team’s routine, not just buying new tools. |
Sales analytics is the practice of collecting, analyzing, and interpreting sales data to generate actionable insights that improve outcomes. It goes well beyond tracking how many calls a rep made last week. Done right, it tells you why deals stall, where pipeline leaks, and which behaviors actually correlate with closed revenue.
Here’s the core distinction: traditional forecasting runs on gut feel and seniority. A VP of Sales looks at the pipeline and makes a call based on experience. That might work in a small team with short cycles. But in complex EU enterprise environments with 6-12 month sales cycles, multiple stakeholders, and cross-border regulatory nuances, instinct just doesn’t scale. Traditional forecasting often relies on instinct instead of data, and that’s a direct path to missed targets.
Real talk: the moment your sales org grows past 20 reps, you can’t manage by feel anymore. You need numbers that tell you where the machine is breaking.
Sales analytics flips this. Instead of tracking activity counts, it tracks leading indicators: the early signals that predict whether a deal will close. Think engagement depth, multi-threading (number of stakeholders contacted), response time, and pipeline velocity (how fast deals move through stages).
For EU enterprises specifically, the stakes are higher. You’re dealing with longer decision cycles, procurement governance, GDPR compliance layers, and often multi-language buyer journeys. Analytics helps you manage that complexity without letting deals fall through the cracks. The impact of AI on sales has also made it easier to generate real-time insights from large data sets, which is a game-changer for teams operating across multiple markets.
Key metrics that sales analytics surfaces:
Understanding consulting’s role in revenue growth can also help you structure your analytics program so that it answers the right business questions from day one.
Knowing that analytics matters is one thing. Knowing which numbers to watch is where most sales leaders either shine or stumble. Let’s make this concrete.
According to B2B enterprise benchmarks, the 2026 standards for EU enterprises look like this:
| Metric | EU Enterprise Benchmark | What it tells you |
|---|---|---|
| Win rate | 18% to 28% | Deal quality and sales process strength |
| Sales cycle length | 78 to 142 days | Process efficiency and buyer complexity |
| Pipeline coverage | 3x to 5x ARR target | Whether you have enough deals to hit quota |
| Quota attainment | ~31% average | Overall team performance health |
| Forecast accuracy | 70%+ target | Reliability of your revenue predictions |
Each of these numbers tells a story. A win rate below 15% is a red flag: it usually signals a qualification problem. You’re letting too many weak deals into the pipeline, burning rep time on accounts that were never going to buy. A win rate consistently above 28% might actually mean you’re being too selective, and leaving revenue on the table.

Sales cycle length above 142 days in complex deals isn’t unusual, but if your average enterprise deal takes 200 days, you need to look at where the delays are. Is it legal review? Budget approval? Champion disengagement? Analytics pinpoints it.
Pipeline coverage at 3x to 5x is the standard buffer. If your team is carrying less than 3x, you’re one bad quarter away from a crisis. More than 5x and you may be wasting resources on low-probability deals.
Here’s a practical diagnostic sequence:
Pro Tip: Run this diagnostic monthly, not quarterly. Waiting 90 days to spot a win rate problem means you’ve already lost deals you could have saved with earlier coaching.
If you want a structured way to run this process, revenue audit checklists give you a repeatable framework for identifying exactly where your sales engine is leaking.
Metrics on a dashboard are useless if they don’t trigger action. The real power of sales analytics is what it tells you to do differently.
Let’s look at how analytics-driven sales compares to instinct-based sales:
| Dimension | Instinct-based sales | Analytics-driven sales |
|---|---|---|
| Forecasting | Manager gut feel | Pipeline velocity and stage data |
| Coaching | Based on tenure or personality | Based on individual metric gaps |
| Resource allocation | Spread evenly or based on seniority | Directed to highest-probability accounts |
| Deal reviews | Subjective storytelling | Data-backed stage analysis |
| Territory planning | Historical habits | Win rate and market penetration data |
The shift from left to right isn’t just about being more sophisticated. It’s about being more accurate. Analytics identifies process bottlenecks, enables cost reduction, and drives measurable performance gains across B2B sales teams.
Three high-impact use cases you should prioritize:
Pro Tip: Use analytics to decide where to not invest, not just where to push harder. Cutting weak pipeline fast frees up rep bandwidth for winnable deals.
This is also where enablement styles for team performance come in. When you know what’s breaking in your process, you can design enablement that fixes the specific gap, rather than running generic training that doesn’t move the needle. And when your team knows that decisions are based on data, not politics or favoritism, buy-in improves. Boosting team ROI starts with showing people the numbers and explaining what the numbers mean for their work.
Ready to move from theory to application? Here’s how to roll out analytics successfully without the usual headaches.
Step-by-step implementation:
Common pitfalls to avoid:
Real talk: most analytics rollouts fail not because the tool was wrong, but because no one changed their behavior after seeing the numbers.
Integrating AI into your analytics workflow can improve forecast accuracy by 20 to 42%, but only if your underlying data is clean and your team is trained to act on AI outputs. AI amplifies what’s already there: good data gets better; bad data gets confidently wrong.
Pro Tip: Pilot analytics in one team or one market segment before scaling. A focused pilot lets you fix process gaps before rolling out to 200 reps.
Use performance review tools to make analytics a regular part of how you evaluate and develop your sales team, not just a quarterly exercise.
Here’s the uncomfortable truth we’ve seen repeatedly in EU enterprise engagements: the organizations that struggle with analytics aren’t failing because they chose the wrong tool. They’re failing because they treated analytics as a reporting upgrade instead of a behavior change program.
Leaders who get real value from their data don’t just look at dashboards. They build analytics into their weekly rhythms. Every pipeline review, every coaching conversation, every territory decision runs through the numbers. It becomes cultural, not optional.
The differentiator isn’t your BI platform. It’s whether your sales managers can look at a metric and immediately ask the right question: why is this number moving, and what do we do about it?
We’ve seen teams with spreadsheet-level analytics outperform teams with enterprise-grade tools simply because the first team acted on what they saw. Structure beats heroics, and consistent interpretation beats sophisticated dashboards. Consulting’s impact on sales change often comes down to exactly this: helping teams build the habits that make data matter, not just the infrastructure.
If you’ve read this far, you’re serious about turning data into revenue. That’s exactly where we work best.
At Sales Label Consulting, we help EU enterprise sales leaders connect analytics to real outcomes: faster cycles, stronger forecasting, and teams that actually use their data. Whether you need a step-by-step sales enablement build, a structured sales audit to identify revenue leaks, or a forward-looking view of enablement trends for B2B growth, we bring the frameworks and the hands-on experience to make it stick. Let’s move beyond insights and build something that performs.
Key metrics include win rate, quota attainment, sales cycle length, and pipeline coverage. EU benchmarks point to win rates of 18 to 28%, sales cycles of 78 to 142 days, and pipeline coverage of 3x to 5x your ARR target.
Sales enablement platforms and AI automate data collection, improve team collaboration, and can boost forecast accuracy by 20 to 42%. European SEP research also shows measurable gains in flexibility and cross-team collaboration.
Map your metrics against benchmarks and look for outliers. A win rate below 15% typically signals lead qualification problems, which means your reps are spending time on deals that were never qualified to begin with.
Define your core metrics first, audit data quality, choose a compatible tech stack, train your team on interpretation, and review results consistently. Implementation is a step-by-step process that requires both technical setup and change management to drive adoption.
Subscribe to our Insights: Expert productivity tips in your inbox
You'll receive 1-3 emails per month. Your data stays private, always.

CRO & Co-Founder with Sales Label Consulting

Watch our Sales Mates Podcast
Available
June 20, 2026 - 8 min read
Read article Read articleJune 19, 2026 - 8 min read
Read article Read articleJune 18, 2026 - 9 min read
Read article Read articleFix the System
Not Symptoms