
Why Quality Leads Matter: A Revenue Leader’s Guide
TL;DR:
- Focusing on lead quality improves conversion rates, reduces costs, and enhances revenue predictability.
- Measuring and improving dimensions like ICP fit, intent signals, access, timing, and data integrity directly impact sales success.
Quality leads matter because they convert faster, cost less per customer, and make your revenue far more predictable. That’s the whole argument, and everything else in this guide is proof and execution.
Here’s what changes when you prioritize lead quality over raw volume:
The rest of this guide covers how to measure lead quality, how to improve it across targeting, scoring, and handoff, and what a realistic 30-to-180-day roadmap looks like.
“Lead quality” is not a feeling. It’s a measurable property built from five distinct dimensions, and your sales and marketing teams need to agree on all five before any scoring or SLA conversation makes sense.
CUFinder defines a quality lead as a prospect that combines ICP fit and genuine intent. That’s a good start, but it’s incomplete for most B2B tech sales motions. Here’s the full picture:
The critical distinction between quality and quantity: they’re not opposites, but they require different optimization targets. Chasing volume optimizes for top-of-funnel numbers. Chasing quality optimizes for revenue per lead. You can have both, but only if quality is defined first.
The downstream effects of poor lead quality compound fast. Here’s how the chain plays out:
Real talk: The morale cost is underestimated. A rep who works 50 leads a month and closes 2 is not just inefficient. They’re demoralized. Fix the lead quality, and you fix the rep’s belief that the system works.
The importance of quality leads isn’t just a marketing metric. It’s a revenue architecture decision.
Vanity metrics like total leads generated or MQL volume tell you how busy your funnel is, not how healthy it is. These are the metrics that matter, with simple formulas your team can track today.
| Metric | Formula | What it signals | Target rationale |
|---|---|---|---|
| MQL → SQL rate | SQLs ÷ MQLs | Whether marketing’s definition of qualified matches sales reality | Higher rate = tighter alignment |
| SQL → Opportunity rate | Opportunities ÷ SQLs | How many qualified leads have real buying intent | Declining rate = scoring model needs recalibration |
| Lead-to-close conversion rate | Closed-won ÷ Total leads | End-to-end funnel efficiency | Baseline for quality improvement tracking |
| Time-to-contact | Hours from lead creation to first contact attempt | Speed of response; contact rate and time-to-close reliably indicate lead value | Under 5 minutes for high-score leads |
| Contact rate | Contacts reached ÷ Total leads attempted | Targeting and data quality upstream | Low rate = data or ICP problem |
| Cost-per-qualified-lead (CPQ) | Total campaign spend ÷ SQLs generated | True cost efficiency vs. CPL | Use to compare channels, not just CPL |
| CAC | Total sales + marketing spend ÷ New customers | Full cost to acquire a customer | Benchmark against LTV |
| LTV/CAC ratio | Customer LTV ÷ CAC | Long-term ROI of your acquisition model | 3:1 or higher is a common B2B benchmark |
Leading vs. lagging indicators: Time-to-contact and contact rate are leading. They tell you right now whether your targeting and data are working. MQL→SQL rate and LTV/CAC are lagging. They confirm whether the system is producing revenue. Use both together.
Pro Tip: Track sales conversion metrics at the channel level, not just the aggregate. A single high-volume channel with a low SQL rate can drag down your entire funnel’s apparent health.
This is the playbook. Work through it in order, because each stage feeds the next.

Pull your last 20 closed-won deals and identify the firmographic and behavioral patterns they share. That’s your ICP. If you haven’t done this recently, your scoring model is built on assumptions, not evidence. Use historical wins to define the right target before you touch any campaign settings.
Messaging, channel selection, and form design all filter intent before a lead ever hits your CRM. Programs that precisely target and apply calibrated friction deliver higher contact rates and shorter time-to-close. That means:
Combine firmographic fit (ICP match), behavioral signals (page visits, content downloads, demo requests), and third-party intent data into a single score. Treat the model as an experiment: start simple, then refine it every quarter using win/loss outcomes. A score that hasn’t been updated in six months is probably wrong.
Enrich records automatically using tools like Clearbit or Apollo to fill gaps in firmographic data. Incomplete records lower scoring accuracy and waste rep time.
Define exactly when a lead routes to sales (score threshold, stage, activity trigger) and how fast sales must respond. For high-score leads, that window should be tight. Contacting a fresh qualified lead within five minutes yields conversion rates up to 21x higher than waiting 30 minutes or more. Make this speed-to-lead rule explicit in your SLA to realize the full impact. Build that into your SLA, not just your best practices doc.
Leads that don’t meet the handoff threshold go into a nurture track, not a holding queue. Set a clear recycling rule: if a nurtured lead hits a qualifying trigger within 90 days, it re-enters scoring. If it doesn’t, disqualify it and clean the record. Effective lead nurturing workflows keep your pipeline honest and your CRM clean.
Quick checklist:
Pro Tip: For your highest-scoring leads, automate the routing and alert. Don’t rely on a rep checking a queue. Speed-to-lead at the top of your score range is where the biggest conversion gains live.
Most teams know their lead quality is off. Fewer know exactly why. These are the red flags to diagnose first.
Data decay compounds every mistake above. Contact information degrades over time, and stale records mean your reps are calling wrong numbers and emailing inactive addresses. Without regular enrichment and validation, even a well-targeted campaign produces a low contact rate. Schedule enrichment cycles, not just one-time cleanups.
The evidence for prioritizing lead quality over volume is consistent across both industry research and client work.
Saleslabelconsulting’s internal data from B2B tech client pilots shows that implementing a structured lead qualification process combining scoring, ICP alignment, and SLA enforcement produced approximately a 40% uplift in tech sales performance. The mechanism: fewer leads worked per rep, but each lead had a materially higher probability of closing. Pipeline accuracy improved because disqualified leads were removed faster, and reps spent more time on deals that actually moved.
That maps directly to the measurement framework: MQL→SQL rate improved because the shared definition tightened, time-to-contact dropped because routing was automated for high-score leads, and CAC fell because fewer resources were spent on leads that were never going to close.
The industry research reinforces this. Speed-to-lead is a critical tactical variable for qualified prospects. Contacting a qualified lead promptly greatly improves conversion rates compared to longer delays. That’s not a marginal improvement. It’s a structural advantage you can build into your process today.
Sales and marketing alignment is the organizational condition that makes all of this stick. Without a shared definition and a shared SLA, scoring models drift and handoff quality degrades over time.
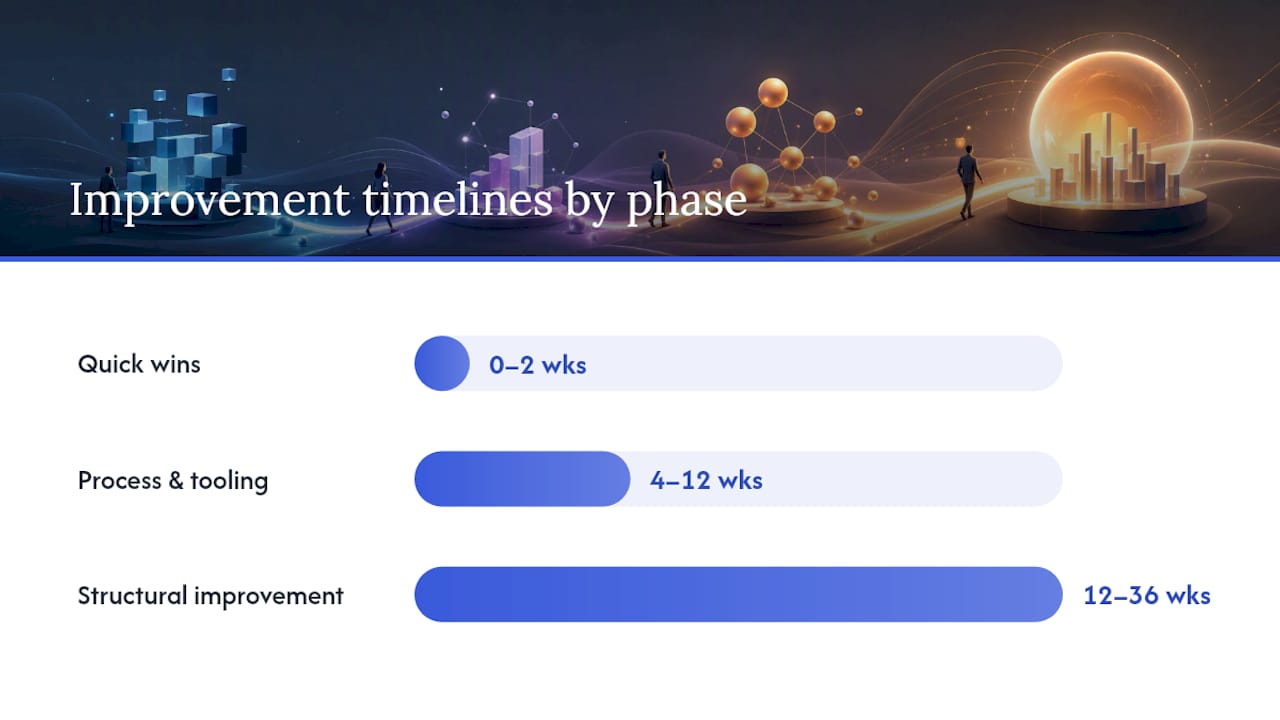
Speed-to-impact varies by where you start. Here’s a realistic phased view.
Weeks 0–2 (quick wins, near-zero cost): Agree on a shared qualified-lead definition. Set a handoff SLA and automate routing for your top score tier. Audit your CRM for open disqualified deals and close them out. These changes cost almost nothing and immediately improve pipeline accuracy.
Months 1–3 (process and tooling investment): Refine your ICP using closed-won data. Rebuild or recalibrate your scoring model with firmographic and behavioral signals. Add enrichment to your capture workflow. Launch a quality-focused pilot on one channel and measure CPL vs. CPQ. Expect MQL→SQL rate to start improving within 6–8 weeks of tighter definitions.
Months 3–9 (structural improvement): Expand successful channels. Automate enrichment at scale. Measure LTV/CAC improvements and iterate scoring quarterly. This is where CAC reductions and LTV improvements become visible in the data.
Major cost drivers to plan for: enrichment tool subscriptions (Clearbit, Apollo, or similar), intent data platforms, CRM automation setup, campaign retargeting on quality-focused channels, and consulting or advisory support for scoring model design and SLA governance. The highest-ROI moves in the first 30 days, SLA enforcement and routing automation, require almost no budget. Invest there first before committing to data or tooling spend.
Lead quality is the single most controllable variable between a pipeline that looks healthy and one that actually closes.
| Point | Details |
|---|---|
| Define quality before scoring | Agree on ICP fit, intent, authority, timing, and data integrity as the five dimensions of a qualified lead. |
| Measure CPQ, not just CPL | Shift from cost-per-lead to cost-per-qualified-lead to reveal which channels actually produce revenue. |
| Speed-to-lead is structural | Contacting a qualified lead within five minutes converts up to 21x better than a 30-minute delay; automate routing for high-score leads. |
| Quick wins cost almost nothing | SLA enforcement, shared definitions, and CRM hygiene in weeks 0–2 improve pipeline accuracy before any tooling spend. |
| Saleslabelconsulting accelerates the process | Structured qualification, scoring, and SLA work in client pilots produced approximately a 40% uplift in tech sales performance. |
Here’s what I’ve seen consistently: teams that struggle with lead quality almost always have a volume incentive baked into their metrics. Marketing is measured on MQL count. Sales is measured on pipeline created. Neither team is measured on what actually closes. The result is a system that’s optimized to look productive while quietly leaking revenue.
The fix isn’t a better scoring tool. It’s a leadership decision to redefine success. When marketing is measured on SQL rate and CAC contribution, and when sales is measured on close rate and LTV, the incentives align and the quality conversation becomes easy.
My practical tip: run a one-month SLA pilot on a single channel. Pick your highest-intent source, set a five-minute response SLA for leads above your score threshold, and measure contact rate and SQL rate before and after. One month. One metric. That’s enough data to make the case internally for a broader quality-first shift.
If your pipeline looks full but revenue keeps missing, the problem is almost always upstream: a weak ICP, a scoring model that hasn’t been updated, or a handoff SLA that exists on paper but not in practice.
Saleslabelconsulting works with B2B tech revenue teams to audit qualification processes, rebuild scoring models, and design SLA frameworks that hold. Engagements typically run as fixed-scope audits or 30-to-90-day pilots, and the starting point is always the same: a sales process audit that identifies exactly where quality is breaking down and what it’s costing you. If you’re ready to move from volume metrics to revenue metrics, see how the sales enablement process works and book a discovery call.
Subscribe to our Insights: Expert productivity tips in your inbox
You'll receive 1-3 emails per month. Your data stays private, always.

CRO & Co-Founder with Sales Label Consulting

Watch our Sales Mates Podcast
August 26, 2026 - 9 min read
Read article Read articleAugust 25, 2026 - 8 min read
Read article Read articleAugust 24, 2026 - 8 min read
Read article Read articleAugust 23, 2026 - 11 min read
Read article Read article