
Sales KPIs explained: boost team performance and revenue
TL;DR:
- Tracking activity metrics alone is ineffective; focus on conversion and win rates for meaningful insights.
- Regular KPI reviews should be paired with specific actions to improve sales outcomes.
- Using KPIs as diagnostic tools helps identify root causes and drives consistent performance improvement.
Most B2B sales teams are tracking the wrong things. They count calls made, emails sent, and meetings booked, then wonder why those numbers don’t translate into predictable revenue. The real problem isn’t effort. It’s measurement. When you track activities without connecting them to outcomes, you’re flying the plane without instruments. This guide cuts through the noise. We’ll define what sales KPIs actually are, walk you through the ones that matter most for mid-sized B2B teams, and give you a concrete system for implementing and reviewing them so they drive real coaching and real results.
| Point | Details |
|---|---|
| KPIs vs. metrics | Not all metrics are KPIs; focus on those tied to outcomes for real impact. |
| Essential B2B KPIs | Prioritize conversion rate, win rate, and sales cycle length for actionable insights. |
| Use CRM dashboards | Leverage CRM tools to track, review, and act on sales KPIs efficiently. |
| Review regularly | Assess KPIs on a daily, weekly, and monthly basis for ongoing improvement. |
| Act on the data | True results come from coaching and making changes based on KPI trends, not just reporting numbers. |
Let’s get the definition right first, because this is where most teams go wrong.
A Key Performance Indicator (KPI) is a measurable value that’s directly tied to a strategic goal. Not every number you track is a KPI. A KPI tells you whether you’re moving toward a specific outcome. A generic metric just tells you something happened.
There are two types you need to know:
Most teams over-index on lagging indicators because they’re easy to see. Revenue is right there in the dashboard. But by the time you see a lagging number drop, it’s usually too late to fix it for that quarter.
“The goal isn’t to track everything. The goal is to track the right things and act on them fast enough to change outcomes.”
Here’s the critical insight: activity KPIs motivate volume but often ignore quality. Calls per day is an activity metric. It tells you a rep is busy, not that they’re effective. Conversion ratios, on the other hand, tell you whether the activity is actually producing results. That’s the shift that separates high-performing sales orgs from everyone else.
When you align your sales performance review process with KPIs that reflect both leading and lagging indicators, you stop reacting to problems and start preventing them. And when you pair that with right CRM tools, your visibility into what’s actually happening in the pipeline becomes a genuine competitive advantage.
Pro Tip: Before adding a new metric to your dashboard, ask one question: “What decision will this data help me make?” If you can’t answer it quickly, that metric probably isn’t a KPI.
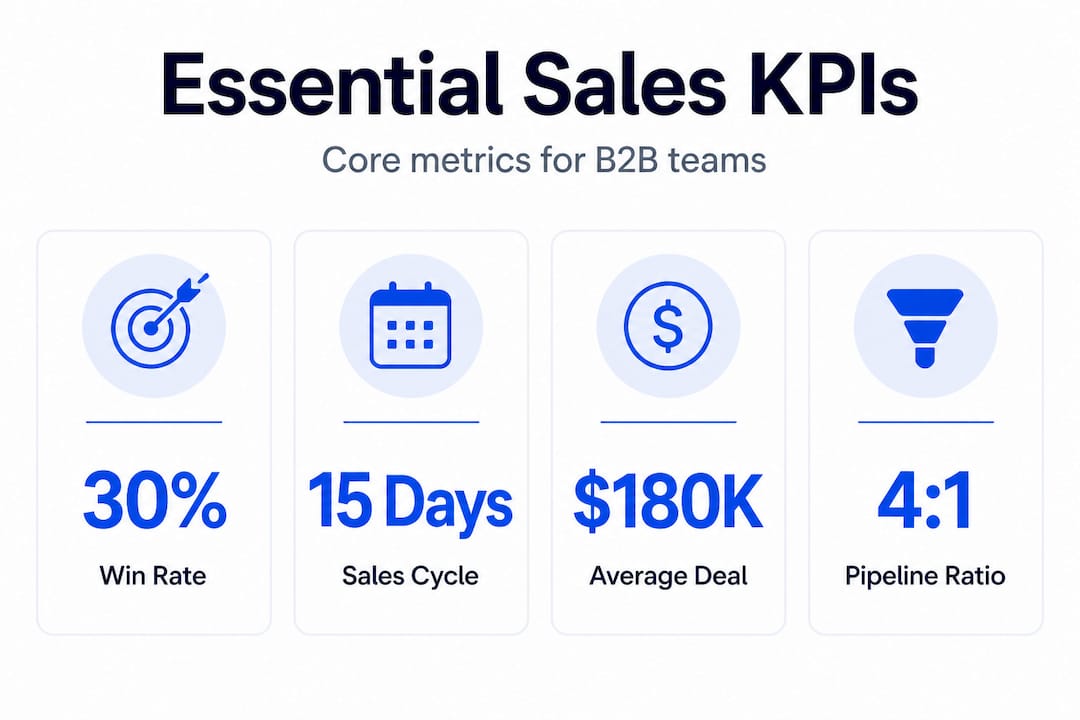
Now that we’ve sorted out the definition, let’s talk about which KPIs actually move the needle for mid-sized B2B teams. There are five core ones you should be monitoring, and each plays a distinct role.
Conversion rate: The percentage of leads or prospects that advance to the next stage. You calculate it by dividing the number of converted prospects by total prospects, then multiplying by 100. This is one of your strongest leading indicators of revenue health.
Win rate: The percentage of opportunities that close as “won.” Calculate it by dividing closed won deals by total closed deals. This tells you how effective your team is at the bottom of the funnel, and it’s a direct reflection of your sales process quality.
Sales cycle length: The average number of days from when an opportunity is created to when it closes. According to recent data, mid-market cycles average 78 days and are trending longer year over year. That’s a signal, not a fact to ignore.
Average deal size: Total revenue divided by number of deals closed. Tracking this over time shows whether your team is moving upmarket, discounting too aggressively, or consistently closing the right type of customer.
Activity metrics: Calls made, emails sent, demos completed. These are still valuable, but only in context. When paired with conversion data, they reveal efficiency. In isolation, they just measure effort.
Here’s a quick reference table to keep things clear:
| KPI | What it measures | How to calculate | When to use it |
|---|---|---|---|
| Conversion rate | Lead-to-opportunity progression | (Converted / Total) x 100 | Weekly pipeline reviews |
| Win rate | Closed won vs. total closed | (Won / Total closed) x 100 | Monthly performance review |
| Sales cycle length | Speed from open to close | Avg. days per closed deal | Quarterly trend analysis |
| Average deal size | Revenue per deal | Total revenue / Deals closed | Forecasting and planning |
| Activity metrics | Rep effort and volume | Count per rep per period | Daily coaching and accountability |
Browse deeper sales metrics examples to see how each KPI plays out across different tech sales contexts. And if you want to understand where each KPI sits within the buyer journey, exploring the sales cycle stages framework will give you that structural grounding.
Pro Tip: Don’t try to track all five at once if your team is just starting out. Pick two, conversion rate and win rate, and build the habit of reviewing and acting on them before adding more.
Knowing your KPIs is step one. Building a system to track and act on them consistently is where most teams actually struggle.

Start with your CRM. Every major CRM platform today can surface the core KPIs we’ve covered, but they won’t do it by default. You need to configure dashboards intentionally. Here’s what a sample KPI dashboard view should look like for a mid-sized B2B team:
| KPI | Owner | Target | Review frequency |
|---|---|---|---|
| Conversion rate (lead to opp) | RevOps | 25% | Weekly |
| Win rate | Sales Manager | 30% | Monthly |
| Sales cycle length | Sales Manager | 75 days | Monthly |
| Average deal size | VP of Sales | $28,000 | Monthly |
| Outbound calls per rep | Team Lead | 40 per week | Daily |
The review cadence matters as much as the data itself. Here’s the structure that works: daily reviews for activity metrics, weekly reviews for pipeline health, and monthly reviews for revenue and outcome KPIs. Each cadence serves a different purpose.
That last point is critical. KPI reviews without action are just meetings. Every review should produce a clear next step, whether that’s a coaching conversation, a process change, or a rep-specific improvement plan.
“Data without action is just noise. The best sales teams use KPI reviews to ask one question every time: What’s one thing we’re changing this week because of this data?”
Your sales KPI review checklist is a practical starting point for structuring those conversations so they’re consistent and efficient. And for teams that want to take pipeline visibility even further, applying pipeline optimization strategies alongside KPI tracking creates compounding improvements over time.
Need help configuring your dashboards? These CRM dashboard tips are worth bookmarking for your RevOps team.
Here’s where we get into the stuff that isn’t covered in most KPI articles. The technical setup is the easy part. The hard part is avoiding the traps that make good data useless.
Pitfall 1: Over-relying on activity metrics
Calls per day and emails sent are the comfort food of sales KPIs. They feel productive. They’re easy to measure. And they can hide serious problems. A rep making 60 calls a day with a 2% conversion rate is burning effort for minimal return. Tracking conversion ratios for effectiveness instead of raw activity volume gives you a much clearer picture of what’s actually working.
Pitfall 2: Ignoring trends in sales cycle length
A single data point means nothing. A trend tells you everything. If your average sales cycle length grows from 75 days to 95 days over two quarters, that’s a signal. It could mean your qualification is slipping. It could mean buyers are adding more stakeholders to the decision process. Either way, you need to investigate, not just note it and move on.
Pitfall 3: Setting KPIs once and never revisiting them
Buyer behavior shifts. Competitive dynamics shift. Your ideal customer profile evolves. KPIs that were right 18 months ago may not reflect current reality. Build a quarterly review of your KPI set itself, not just the numbers within it.
Pitfall 4: Using KPIs for reporting, not coaching
This is the big one. Most managers pull the weekly report, nod at the numbers, and move on. But the real value of a KPI is the conversation it should start. If win rate drops, that’s a coaching trigger. If a rep’s sales cycle is consistently longer than the team average, that’s a discovery conversation. Understanding why sales metrics matter beyond reporting is what separates managers who build strong teams from those who just manage spreadsheets.
Pro Tip: Map each KPI to a specific coaching action. If win rate drops below 25%, that triggers a deal review process. If conversion rate falls below 20%, that triggers a prospecting quality audit. Remove ambiguity. Structure beats heroics.
Also worth reviewing: these explained sales metrics give you a broader picture of how individual KPIs fit within a larger performance framework.
For teams that want a step-by-step approach to improving individual metrics, this sales conversion guide offers practical tactics that complement your KPI framework.
Real talk: most sales leaders know their numbers. They can tell you win rate, average deal size, and pipeline coverage without blinking. But knowing the number and knowing what to do with it are two completely different skills.
Here’s the uncomfortable truth we see repeatedly when working with mid-sized B2B teams. They’ve built solid dashboards. Their CRM is clean. Their KPIs are well defined. And yet their results are still inconsistent. Why? Because they’re treating KPIs as a scorecard instead of a diagnostic tool.
A scorecard tells you the final score. A diagnostic tool tells you why you got that score and what to do differently. The shift from scorekeeping to diagnosis is the real differentiator.
Here’s how we frame it: every KPI is a symptom. Win rate declining? That’s a symptom. The question is whether the root cause is messaging quality, competitive positioning, deal qualification, or something in the closing process. Without digging to the root cause, you’ll prescribe the wrong fix and wonder why the number doesn’t move.
The process that works looks like this. First, identify the KPI that’s off target. Second, segment the data. Don’t look at team-wide averages. Look by rep, by deal type, by market segment. Third, form a hypothesis about the root cause. Fourth, test a specific intervention. Fifth, measure the impact in the next review cycle.
That’s a diagnostic loop, not a reporting loop. And it’s what transforms a weekly KPI review from a check-in into a genuine improvement engine.
The teams we’ve worked with that adopt this mindset consistently see measurable improvement within two to three quarters, without adding headcount or changing their tech stack. You can start by honestly measuring sales effectiveness across your current team to establish the baseline for that diagnostic work.
Structure beats heroics. Every time.
You’ve got the framework. Now it’s time to put it into motion.
At Sales Label Consulting, we help RevOps leaders, Heads of Sales, and VPs of Sales build KPI systems that actually produce results, not just reports. Our work covers the full sales enablement process, from establishing the right metrics to coaching your managers on how to use data in their daily conversations. We also help teams align their sales enablement best practices with revenue goals so nothing falls through the cracks. And if you want to know whether your current enablement efforts are producing a return, our work on sales enablement metrics gives you the measurement foundation to answer that question clearly. Let’s build something that performs.
A sales KPI is a measurable value tied directly to a strategic sales goal, while a sales metric is any number tracked within the sales process. Not all metrics qualify as KPIs.
Review daily for activities, weekly for pipeline health, and monthly for revenue outcomes to keep teams aligned and enable continuous improvement.
Conversion rate and win rate are the strongest predictors, as conversion ratios reflect effectiveness far more reliably than raw activity volumes like calls or emails per day.
Sales cycle length reveals how quickly deals move and where bottlenecks appear in your process. With mid-market cycles averaging 78 days and trending longer, monitoring this KPI is critical to staying competitive and protecting your forecast accuracy.
Subscribe to our Insights: Expert productivity tips in your inbox
You'll receive 1-3 emails per month. Your data stays private, always.

CRO & Co-Founder with Sales Label Consulting

Watch our Sales Mates Podcast
Available
June 23, 2026 - 8 min read
Read article Read articleJune 22, 2026 - 7 min read
Read article Read articleJune 21, 2026 - 8 min read
Read article Read articleFix the System
Not Symptoms