
Sales metrics explained: key indicators for EU growth 2026
Sales teams often drown in data, tracking dozens of metrics yet missing the few that actually drive revenue. Many EU sales organizations measure activity without clarity on which indicators predict success or validate results. This guide cuts through the noise to explain the critical sales metrics that matter most in 2026. You’ll learn how to balance leading and lagging indicators, understand benchmarks for meetings booked and response times, and discover why focusing on 20% of metrics explains 80% of sales outcomes. We’ll show you how to optimize performance through strategic metric selection and sales enablement practices.
| Point | Details |
|---|---|
| Balance leading and lagging metrics | Track 60% leading indicators for immediate actions and 40% lagging for outcome validation |
| Meetings booked predicts pipeline health | Top outbound SDRs booking 15+ meetings monthly with 80% show rates drive consistent revenue |
| Response speed wins deals | Up to 50% of sales go to the first responder, yet average teams take 42 hours |
| Focus on high impact KPIs | Roughly 20% of sales metrics explain 80% of results, so prioritize these revenue drivers |
| Enablement platforms amplify results | SEPs improve collaboration and efficiency, directly boosting key metric performance |
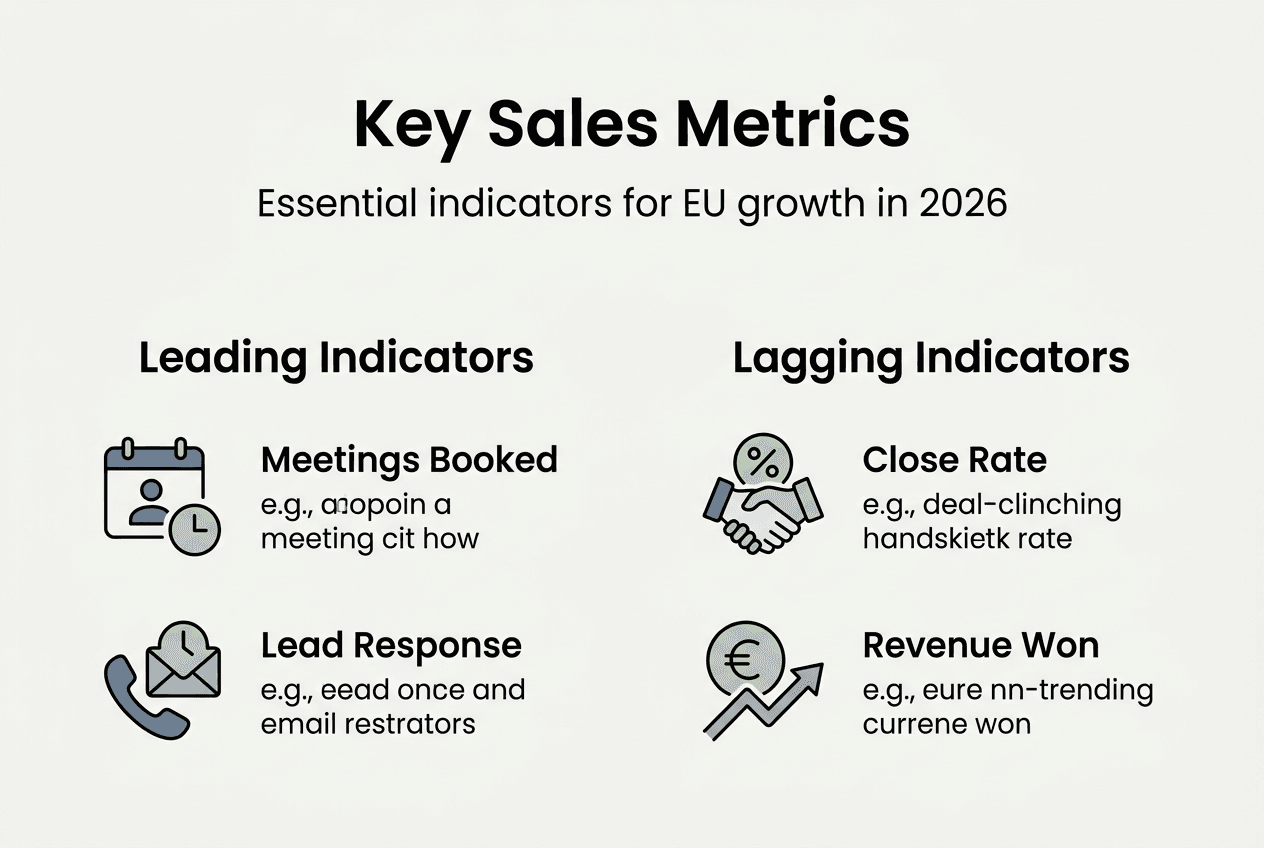
Sales metrics fall into two fundamental categories that serve different strategic purposes. Leading indicators measure immediate sales activities like calls made, emails sent, meetings booked, and pipeline additions. These metrics predict future performance and allow you to take corrective action before outcomes materialize. Lagging indicators, by contrast, capture outcomes such as win rate, revenue closed, customer acquisition cost, and average deal size. These validate whether your activities translated into business results.
High-performing sales teams maintain a 60/40 balance: 60% leading indicators and 40% lagging indicators to guide actions and validate outcomes. This split supports agile decision making while providing long-term validation of strategy. For EU B2B sales teams, leading indicators might include discovery calls completed, demos scheduled, and proposals sent. Lagging indicators encompass quarterly revenue, customer lifetime value, and churn rate.
Tracking this balance delivers several concrete benefits:
Understanding sales performance metrics importance helps you build dashboards that drive action rather than just report history. Leading indicators tell you what to do today, while lagging indicators confirm whether yesterday’s actions worked. This dual perspective creates accountability and agility simultaneously.
Meetings booked by outbound sales development representatives serves as a powerful leading indicator of pipeline health. This metric measures scheduled appointments between prospects and account executives, revealing both outreach effectiveness and lead quality. Unlike cold calls or emails sent, meetings booked represents genuine prospect interest and advances opportunities through your sales funnel.

Benchmark data shows significant performance variation across teams. Outbound SDRs booking approximately 15 meetings per month achieved an 80% show rate and roughly 12 meetings held monthly, indicating strong pipeline health. Average performers typically book 5 to 25 meetings per SDR monthly, while top teams consistently target 15 or more. The gap between meetings booked and meetings held reveals critical insights about lead qualification and scheduling processes.
Several factors impact meetings booked performance:
Pro Tip: Track both volume and conversion of meetings. Booking many appointments signals strong outreach, but held meetings reveal lead quality and process efficiency. A drop in show rates often indicates poor qualification or misaligned messaging that needs immediate correction.
Improving meetings booked requires systematic optimization of your outbound motion. Refine targeting criteria to focus SDR effort on high-fit accounts. Test message variations to identify resonant value propositions. Implement multi-touch sequences that persist without annoying prospects. Invest in sales team mastery strategies that develop SDR skills through role-playing and call reviews. Monitor this metric weekly to spot trends before they impact pipeline coverage.
Lead response time measures the elapsed hours between a prospect expressing interest and your first meaningful contact attempt. This metric profoundly impacts conversion because buyers actively evaluate multiple vendors simultaneously. Up to 50% of sales go to the first vendor who responds to a lead, but average response times linger around 42 hours. This gap between best practice and reality creates massive opportunity for teams that prioritize speed.
The relationship between response time and close rates is stark:
| Response Time | Typical Close Rate | Top Performer Close Rate |
|---|---|---|
| Under 5 minutes | 4% to 6% | 9% to 12% |
| 5 to 60 minutes | 3% to 5% | 7% to 10% |
| 1 to 24 hours | 2% to 4% | 5% to 8% |
| Over 24 hours | 1% to 2% | 3% to 5% |
Average B2B close rates by industry range from 2% to 5%, while top performers consistently exceed 7%. The difference often comes down to response discipline and lead routing infrastructure. Every hour of delay reduces your win probability as prospects engage competitors and form initial preferences.
Strategies for improving lead response times include:
Pro Tip: Leverage technology and clear processes to reduce lag and increase first-responder win probability. Set up round-robin assignment with automatic escalation if the first rep doesn’t respond within 10 minutes. Track response time by rep and make it a core performance metric alongside meetings booked.
Mastering sales enablement best practices includes building systems that eliminate response delays. Speed signals seriousness to prospects and captures them before competitors even know they’re in the market.
Sales enablement platforms are integrated software solutions that centralize content, training, coaching, and analytics to improve sales effectiveness. These platforms serve as the operational backbone for modern sales organizations, connecting marketing, sales, and revenue operations around shared workflows and data. For EU tech firms navigating complex B2B sales cycles, SEPs provide critical infrastructure for scaling performance.
SEPs reduce costs, increase flexibility, and optimize organizational collaboration, enhancing sales team outcomes. They improve collaboration across sales, marketing, and operations by providing a single source of truth for content, playbooks, and customer insights. Marketing can see which materials actually drive deals, sales can access the right content at the right moment, and operations can identify coaching opportunities from conversation analytics.
Specific benefits include:
SEPs help teams focus on key metrics rather than extraneous activity measures by surfacing what actually correlates with wins. Instead of celebrating email volume, you can track content engagement that predicts deal advancement. Rather than counting calls, you can analyze talk-to-listen ratios that separate top performers from average reps. This data-driven approach supports objective coaching conversations and strategic resource allocation.
The positive impact of SEPs on core metrics is measurable. Teams using enablement platforms report higher meeting booking rates because reps access better messaging and value propositions. Response times improve through mobile notifications and streamlined workflows. Close rates increase as sellers deliver more relevant, personalized interactions informed by buyer insights. Understanding sales enablement trends 2026 helps you select platforms aligned with evolving buyer expectations and sales motions.
Not all metrics deserve equal attention on your dashboard. Strategic metric selection focuses your team on indicators that trigger action and drive revenue rather than vanity measures that look impressive but don’t influence decisions. This comparison helps EU sales leaders prioritize effectively:
| Metric | Type | Benchmark | Revenue Impact | Primary Use Case |
|---|---|---|---|---|
| Meetings booked | Leading | 15+ per SDR monthly | High | Pipeline generation and SDR productivity |
| Lead response time | Leading | Under 5 minutes | Very High | Conversion optimization and routing efficiency |
| Win rate | Lagging | 20% to 30% | High | Sales effectiveness and deal qualification |
| Average deal size | Lagging | Varies by segment | Medium | Pricing strategy and account targeting |
| Sales cycle length | Both | 60 to 90 days B2B | Medium | Process efficiency and forecasting accuracy |
| Pipeline coverage | Leading | 3x to 5x quota | Very High | Capacity planning and activity levels |
Roughly 20% of sales metrics explain 80% of sales results, so focusing on these high-impact KPIs is crucial. This Pareto principle applies directly to sales analytics. Most teams track 30 or more metrics but make decisions based on five to seven core indicators. The rest creates noise that distracts from revenue-generating activities.
Best practices for selecting and refining KPIs on dashboards include:
Tracking too many activity metrics buries the revenue-driving indicators that deserve focus. If a metric doesn’t inform coaching, resource allocation, or strategic decisions, remove it from regular reporting. This discipline keeps your team focused on what matters and prevents analysis paralysis. Explore sales enablement metrics overview to understand how enablement KPIs integrate with broader sales performance measurement.
Continuous review ensures your metrics evolve with your business. What matters for a startup building initial pipeline differs from what matters for a scale-up optimizing unit economics. Regularly ask whether each tracked metric still drives decisions, and ruthlessly cut those that don’t.
Tracking the right sales metrics is just the starting point. Translating metric insights into consistent revenue growth requires proven enablement strategies tailored to your team’s specific challenges. Sales Label Consulting helps EU sales leaders master the enablement practices that turn data into predictable, scalable results. Our expertise in sales enablement, audit, and demand generation ensures you focus on high-impact metrics while building the processes and skills to improve them systematically.
Whether you’re refining your approach to meetings booked, accelerating lead response times, or implementing sales enablement platforms, we provide practical support for measurable improvement. Explore our sales enablement step by step guide to build predictable revenue at scale. Learn current sales enablement best practices that top EU teams use to outperform competitors. Stay ahead of emerging sales enablement trends 2026 shaping B2B sales success. Partner with experts who understand both the metrics and the enablement strategies that drive them.
Meetings booked, lead response time, close rate, win rate, and pipeline coverage represent the most critical sales metrics for EU revenue teams in 2026. These indicators balance leading activities that predict performance with lagging outcomes that validate results. Balancing both types yields the fullest performance insight and enables both proactive coaching and strategic validation.
Sales enablement platforms streamline communication and data sharing across sales, marketing, and operations teams, boosting alignment and process efficiency. This integration leads to improved meeting bookings through better messaging, faster lead responses via automated routing, and higher close rates from more relevant customer interactions. SEPs also provide analytics that help teams focus on high-impact metrics rather than vanity measures.
Target approximately 15 meetings booked monthly per outbound SDR with an 80% show rate, representing strong pipeline health for B2B sales teams. For lead response time, aim to reduce response lag well below the 42-hour average, ideally reaching prospects within five minutes to maximize win probability. Top performers consistently hit these benchmarks through disciplined processes and enabling technology.
Tracking too many activity metrics buries the revenue-driving indicators that actually inform decisions and coaching. Focusing on the 20% of metrics that explain 80% of results allows sharper coaching conversations, clearer accountability, and better sales outcomes. Most teams make decisions based on five to seven core indicators, so streamlining your dashboard to these high-impact KPIs prevents analysis paralysis and keeps everyone focused on what drives revenue.
Subscribe to our Insights: Expert productivity tips in your inbox
You'll receive 1-3 emails per month. Your data stays private, always.

CRO & Co-Founder with Sales Label Consulting

Watch our Sales Mates Podcast
Available
July 8, 2026 - 8 min read
Read article Read articleJuly 7, 2026 - 8 min read
Read article Read article