
Quota Attainment: A Manager’s Guide to Calculation and Fixes
Quota attainment is the percentage of a sales quota actually achieved in a defined period. The formula is simple: (Actual Sales ÷ Quota) × 100. A rep who closes $85,000 against a $100,000 quarterly quota hits 85% attainment. That single number drives performance reviews, commission payouts, forecast calls, and hiring decisions. You can read it three ways:
Quota attainment is the single most-used sales metric and the most frequently misread one; reading it by cohort and distribution, not just as a blended average, is what separates a useful diagnostic from a misleading headline.
| Point | Details |
|---|---|
| Core formula | (Actual Sales ÷ Quota) × 100; works identically for individual reps and team roll-ups. |
| B2B SaaS benchmark | Healthy company-level attainment often sits around 60–70%; below 50% typically signals quota or pipeline problems, not rep failure. |
| Blended averages mislead | One rep at 150% can carry three at 40% and produce a team number that looks acceptable. Always check the distribution. |
| First diagnostic step | Slice attainment by cohort (hire date and territory) to separate planning failures from execution failures within one week. |
| Saleslabelconsulting | Runs structured sales audits to identify quota, pipeline, or enablement root causes and deliver prioritized fixes for B2B tech teams. |
The math is identical at both levels; only the inputs change.
Rep level: (Actual Sales ÷ Rep Quota) × 100
Team level: (Sum of All Reps’ Actual Sales ÷ Sum of All Reps’ Quotas) × 100
In SaaS, the numerator is usually ARR or bookings, not recognized revenue. A team that books $1,200M booked against a $2,000M ARR quota sits at 60%, regardless of how that revenue is recognized on the income statement. MRR works the same way, just on a monthly cycle. Use bookings when you want a leading signal; use recognized revenue when finance needs a GAAP-compliant view.
Worked team example:
Pacing during a period keeps you from discovering a miss on the last day of the quarter. The formula: (Booked to date ÷ Days elapsed) × Total days in period. If Rep A has booked $54,000 through day 45 of a 90-day quarter, their pace projects to $108,000, right on track. Run this weekly, not monthly.
Prorating for ramp: a new hire in month two of a three-month ramp should carry a prorated quota, not a full one. A common approach is to assign 50% of full quota in month one, 75% in month two, and 100% from month three onward. Skipping proration inflates the denominator and makes the team number look worse than it is.
Pro Tip: When a ramped hire closes a deal that spans the ramp boundary, credit it to the period the deal closed, not the period it was sourced. Over-crediting ramp-period deals to post-ramp quotas distorts both the rep’s attainment and your capacity model.
Attainment is not just a report card. It’s the input that drives four operational decisions every quarter:
A team attainment trend dropping from 78% to 64% over two quarters is a signal to audit quota design and pipeline coverage before adding headcount. Adding reps into a broken system just scales the problem.
For a deeper look at how attainment connects to commission plan design, the mechanics matter more than most managers realize.
Ranges vary by industry, segment, and quota design, but here’s a practical framework for B2B SaaS:
Benchmark note: In B2B SaaS, company-level attainment around 60–70% is often considered healthy, but that range assumes a reasonably distributed quota population. A single team at 95% with three at 40% can produce a 65% blended number that looks fine and hides a structural problem.
Caveats matter here. Seasonality, territory maturity, and whether you’re measuring bookings vs. recognized revenue all shift the baseline. A new territory with a full quota in quarter one will almost always underperform. Cohort and trend analysis beats a single-period headline every time.
The blended average is the most dangerous number in sales reporting. One rep at 150% can carry three at 40% and produce a team number that looks acceptable. That’s not a team performing at 82%; that’s one person and three problems.
Common pitfalls:
Pro Tip: Run your first diagnostic slice by cohort: group reps by hire date and territory. If new hires are all below 50% and veterans are at 80%+, the issue is ramp design or onboarding, not market conditions. If veterans and new hires are both struggling in one territory, it’s a territory or pipeline problem.
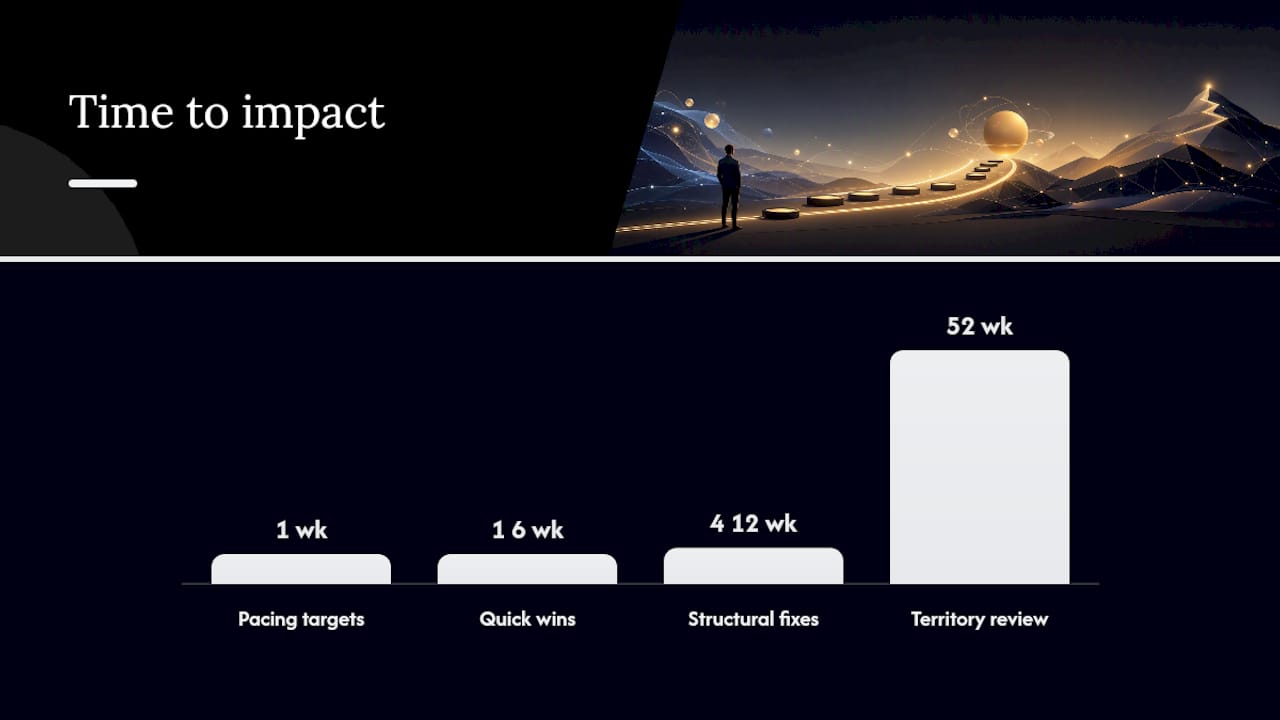
Start with the levers that move fastest.
Quick wins (weeks 1–4):
Structural fixes (weeks 4–12):
Pro Tip: Before redesigning quotas, run a sales audit to confirm whether the shortfall is in quota design, pipeline, or rep skills. Redesigning quotas when the real problem is pipeline coverage just resets the clock without fixing anything.
Attainment tells you the score. These metrics tell you why.
A practical manager dashboard:
| Metric | What it reveals | Threshold to monitor |
|---|---|---|
| Pipeline coverage | Volume risk before the quarter closes | Below 3x quota |
| Win rate | Skills or competitive execution gap | Drop of 5+ points quarter over quarter |
| Average deal size | Discounting or market mix shift | Decline compared to prior period |
| Sales cycle length | Velocity risk and deal health | Increase compared to baseline |
| Forecast accuracy | Planning reliability | Miss vs. called number |
| Ramp rate | Onboarding effectiveness | New hires below 50% in month 3 |
Use this checklist when attainment drops and you need to find the root cause fast.
| Step | What to check | What a problem looks like |
|---|---|---|
| 1. Verify quota calculation | Confirm quotas were assigned correctly and match the comp plan | Quota in CRM differs from comp plan document |
| 2. Cohort breakdown | Split attainment by hire date, territory, and role | One cohort at 40%, another at 85% |
| 3. Pipeline coverage | Check coverage ratio at start of period | Coverage below 2.5x at period open |
| 4. Rep-level metrics | Win rate, ASP, cycle length per rep | One metric diverging sharply from peers |
| 5. Quota assignment rules | Confirm ramp treatment and proration | Ramped reps carrying full quotas |
| 6. Attribution rules | Verify deal credit is going to the right rep and period | Deals credited to wrong period |
| 7. Seasonality check | Compare to same period last year | Attainment drop matches historical seasonal pattern |
A short diagnostic like this typically identifies whether the root cause is planning or execution within the first seven days. If the checklist points to systemic pipeline shortage or quota over-assignment, that’s when a structured sales audit pays for itself quickly. For complex quota redesigns or multi-territory rebalancing, bringing in an external consultant compresses the timeline from months to weeks.
For capacity planning that feeds realistic quotas from the start, the structure matters as much as the math.
Attainment is the trigger mechanism for most commission plans. The threshold where the accelerator starts, and how steep it is, determines whether your top performers feel rewarded or feel like the plan is capped.
It suppresses commission payouts, which drives turnover among the reps you most want to keep. Quota design and comp plan design are the same conversation, not two separate ones. Attainment triggers accelerators in ways that can materially shift total commission expense, so finance needs to model attainment distribution, not just average attainment, when budgeting comp.
Attainment is the starting point for a coaching conversation, not the whole conversation. The number tells you something is off; the metric breakdown tells you what to fix.
The most effective coaching programs use attainment as a triage tool. Reps below a threshold get a structured review of their pipeline coverage, win rate by stage, and average deal size. That review surfaces whether the gap is a skills issue (coachable), a pipeline issue (a process fix), or a territory issue (a management decision). Coaching without that diagnostic is guesswork dressed up as management.

Sales enablement frameworks that tie playbook updates to attainment data close the loop between what reps are doing and what’s actually working in the market.
These terms get used interchangeably. They shouldn’t.
Quota attainment vs. quota coverage: attainment is a backward-looking measure of what closed. Coverage is forward-looking: how much qualified pipeline exists relative to quota. You can have strong coverage and weak attainment if win rates collapse mid-quarter, or strong attainment with thin coverage if a few large deals close unexpectedly.
Quota attainment vs. win rate: win rate measures the percentage of opportunities that convert to closed-won. Attainment measures revenue vs. target. A rep can have a high win rate on small deals and still miss quota. A rep can have a low win rate on large deals and still hit quota.
Quota attainment vs. sales goals: sales goals are often broader and more qualitative (expand into a new vertical, increase average deal size). Quota attainment is a specific, numeric measure of revenue performance against an assigned target. Goals inform strategy; attainment measures execution.
Here’s a perspective worth sitting with: quota attainment is the most-cited metric in sales and the most frequently misread one. Managers report it, boards review it, and comp plans are built on it. But a blended team attainment number, presented without distribution data, is almost meaningless.
The managers who use attainment well treat it as a diagnostic input, not a final verdict. They slice it by cohort, compare it to pipeline coverage, and ask whether the quota was realistic before they ask whether the rep was effective. That sequence matters. Blaming execution when the system is broken is the fastest way to lose your best people.
Quota attainment problems almost always trace back to one of three root causes: quota over-assignment, pipeline shortfall, or an enablement gap. Saleslabelconsulting runs structured sales audits that identify which one is driving your miss, then deliver a prioritized fix list, not a 60-page deck.

For B2B tech teams dealing with declining attainment, the fastest path forward is a focused audit engagement: verify quota design, map pipeline coverage, and identify the two or three coaching interventions with the highest leverage. If the issue is systemic, a capacity-planning workshop resets the quota model from the ground up. Book a call with the Saleslabelconsulting team to scope the right starting point for your situation.
Subscribe to our Insights: Expert productivity tips in your inbox
You'll receive 1-3 emails per month. Your data stays private, always.

CRO & Co-Founder with Sales Label Consulting

Watch our Sales Mates Podcast
September 22, 2026 - 11 min read
Read article Read articleSeptember 21, 2026 - 8 min read
Read article Read articleSeptember 20, 2026 - 13 min read
Read article Read articleSeptember 19, 2026 - 13 min read
Read article Read article