
The Real Role of Reporting in Sales Performance
TL;DR:
- Effective sales reporting focuses on visibility that prompts timely decisions rather than volume of data.
- Structured review cadences and governance improve forecast accuracy, coaching, and strategic adjustments, driving sales performance.
Most sales leaders assume the problem is not having enough reports. So they build more dashboards, add more fields, and schedule more review meetings. Then nothing changes. The real role of reporting in sales has nothing to do with volume. It’s about creating visibility that compels the right decisions at the right time. The teams that get this right don’t just track performance. They use the sales reporting process as a daily management tool to coach reps, catch at-risk deals, and plan with confidence.
| Point | Details |
|---|---|
| Quality beats quantity | A few focused metrics with clear context outperform a dozen dashboards nobody acts on. |
| Cadence drives accountability | Multiple review rhythms (daily, weekly, monthly) catch problems at different stages before they become pipeline disasters. |
| Governance builds trust | Consistent KPI definitions across sales and finance eliminate disputes and make forecast numbers credible. |
| Reporting enables coaching | Real-time visibility into rep activity lets managers intervene before deals go cold, not after. |
| AI changes the game | Automated, AI-powered reporting removes manual data work and gives leaders an always-on decision layer. |
Before you can fix your reporting, you need to be honest about what it actually is. Sales reporting is the process of collecting, summarizing, and analyzing sales funnel and pipeline data to give managers a clear picture of process health and strategy options. That definition sounds simple. The execution is where most teams fall apart.
There are four main report types you should know cold:
Each report type answers a different question at a different time horizon. Using only one is like driving with your eyes half-closed.
Here is a quick reference for what each report should include:
| Report type | Key metrics | Primary audience |
|---|---|---|
| Daily | Activity volume, new opps, at-risk deals | Frontline managers |
| Weekly | Pipeline movement, forecast delta, conversions | Sales managers, RevOps |
| Monthly | Quota attainment, win/loss, coverage ratio | VP of Sales, Head of Sales |
| Quarterly | ARR growth, CAC, cycle length, team capacity | Exec team, board |
The biggest mistake teams make is treating these reports as archives. Good sales reports answer three questions: How are we performing against target? What does the pipeline look like? What needs to change? If your report doesn’t answer at least one of those questions clearly, it’s noise.
Context matters as much as the numbers. Include reporting period, quota owner, and comparison to prior periods. A rep at 80% of quota in week three of a four-week month is in a different situation than a rep at 80% in week one. The number alone tells you nothing.
Real talk: most sales teams use reporting to explain what already happened. That’s reactive management, and it costs you deals. The real impact of reporting on sales comes when you use it to change what’s about to happen.
Here’s where the shift shows up in practice:
Effective sales reporting connects seller activity, pipeline movement, and quota progress to revenue outcomes. That connection is what separates meaningful leadership reviews from status updates that waste everyone’s time.
Pro Tip: Set a standing rule: every weekly pipeline review must include at least one “what are we going to do differently” decision. If the meeting ends without a specific action item, you’ve reviewed data. You haven’t managed your pipeline.
You can also use proven forecasting steps to connect your reporting cadence directly to forecast reliability. The two are inseparable.
Knowing what to report is one thing. Building the system that makes reporting happen consistently, accurately, and without burning out your RevOps team is another challenge entirely.
Start with your review rhythms. Here’s how to structure them:
Embedding reporting within a sales operating cadence improves quota attainment by 20 to 25% compared to teams that rely on informal or ad hoc reviews. That’s not a marginal gain. That’s the difference between hitting plan and explaining why you missed.
The second pillar is metric governance. Without strict rules on stage definitions, probability weightings, and data completeness, even sophisticated dashboards deliver inaccurate insights. A centralized KPI dictionary prevents disputes. For example, win rate should be standardized as Closed-Won deals divided by total Closed deals, across every team, every quarter. When sales and finance use different definitions, trust breaks down fast.
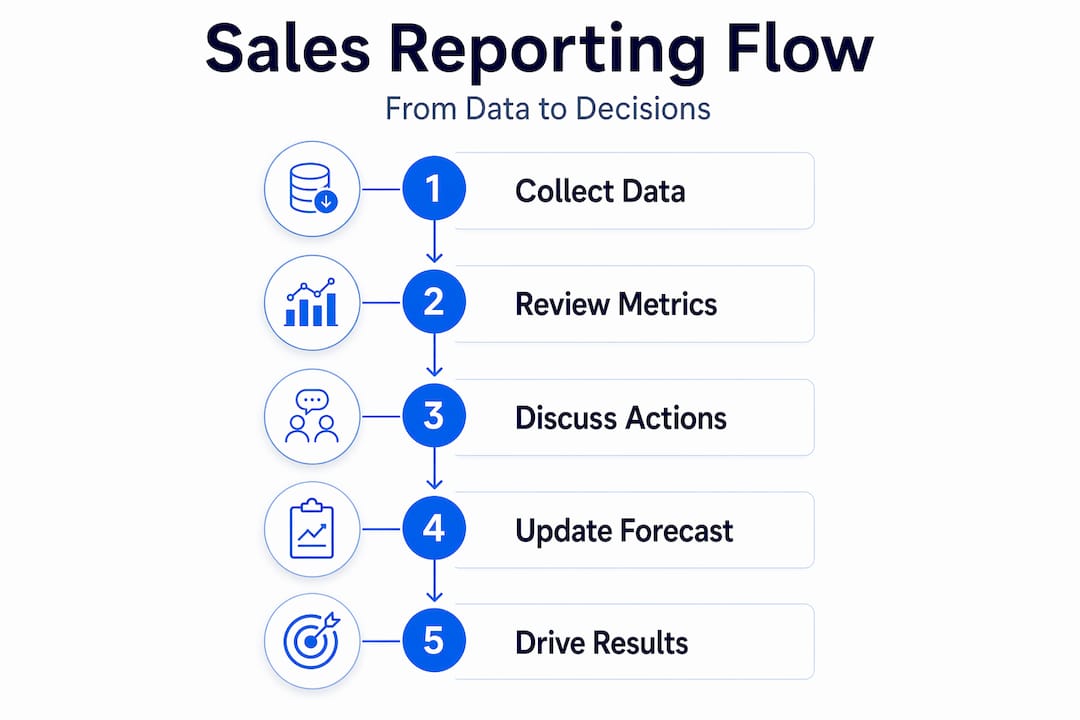
| Approach | Without governance | With governance |
|---|---|---|
| Forecast accuracy | Disputed, inconsistent | Trusted, repeatable |
| Coaching conversations | Based on gut feel | Based on specific data patterns |
| QBR prep time | 3 to 5 days of data cleaning | Under 4 hours |
| Sales and finance alignment | Constant friction | Shared source of truth |
The third pillar is automation. AI-powered sales reporting in 2026 integrates signals from activity, opportunity, and communication data to provide an always-on decision layer that improves forecast accuracy and enables real-time coaching. You don’t need your RevOps analyst spending eight hours a week pulling spreadsheets. Automate the data collection, and let humans focus on the interpretation.

Pro Tip: Align your CRM update timing with your forecast review cadence. If reps update CRM on Fridays but your weekly forecast review is on Thursdays, you’re always reviewing stale data. Shift one of them. This single change removes a surprising amount of forecast noise.
Even teams that commit to structured reporting make predictable mistakes. Here’s what to watch for and how to fix it.
The teams that get the most from their reporting aren’t the ones with the most sophisticated tools. They’re the ones where every person on the team knows why the numbers matter and what they’re expected to do about them. Structure beats heroics, every time.
I’ve worked with enough sales organizations to say this clearly: the biggest barrier to effective reporting isn’t technology. It’s behavior.
Most teams I see have decent CRM tools, a few dashboards, and weekly review meetings. What they lack is the discipline to treat reporting as a leadership practice rather than an admin task. Reps update CRM when they feel like it. Managers review dashboards reactively, after a bad week. Executives see clean QBR slides that don’t reflect what’s actually happening in the pipeline.
The shift I’ve watched transform sales organizations is moving from “let’s review the data” to “let’s use the data to decide what we do next.” That shift is not a technology upgrade. It’s a cultural one. And it requires sales leaders to model the behavior first.
In my experience, the organizations that invest in reporting governance and cadence before they invest in better tools see faster returns. When the data is trustworthy and the review rhythms are consistent, even basic reporting tools deliver results. When the governance is broken, even AI-powered revenue intelligence just automates confusion.
Embed reporting into your daily leadership routines. Review the daily report before you talk to your team. Ask one question every week that only the data can answer. Over time, your team stops seeing reporting as overhead. They start seeing it as their edge.
— Antony
If this article confirmed what you already suspected, which is that your reporting isn’t working as hard as it should, then it’s time to get specific about what to fix.

At Saleslabelconsulting, we work with RevOps leaders, Heads of Sales, and VPs of Sales to build reporting systems that actually drive decisions. Not more dashboards. Smarter ones. We cover everything from KPI governance and sales enablement best practices to full cadence design and CRM data standards. If you want predictable revenue, you need reporting infrastructure that supports it. Explore our step-by-step enablement framework and see exactly where your sales reporting process can close the gap between the pipeline you have and the revenue you want.
The role of reporting in sales is to convert pipeline and activity data into visibility that drives decisions. Effective reporting tells managers where deals stand, where reps need coaching, and how the forecast is trending before it’s too late to act.
Structured sales data reporting standardizes how pipeline data is collected and categorized, which makes it possible to project revenue trends reliably. When every rep uses the same stage definitions and updates CRM consistently, forecast quality improves significantly.
The most critical sales metrics include quota attainment by rep, pipeline coverage ratio, stage-by-stage conversion rates, average deal size, and sales cycle length. Daily reports should also track rep activity volume and deals at risk.
Sales teams benefit from multiple review rhythms: daily for at-risk deals and activity gaps, weekly for pipeline movement, monthly for quota and win/loss trends, and quarterly for strategic and capacity planning. Relying on a single cadence misses critical intervention windows.
A KPI dictionary is a centralized document that defines every metric your team reports on, including exact calculation formulas. It prevents disputes between sales and finance, improves trust in the numbers, and makes reporting consistent as teams grow and change.
Subscribe to our Insights: Expert productivity tips in your inbox
You'll receive 1-3 emails per month. Your data stays private, always.

CRO & Co-Founder with Sales Label Consulting

Watch our Sales Mates Podcast
July 27, 2026 - 9 min read
Read article Read articleJuly 26, 2026 - 13 min read
Read article Read articleJuly 25, 2026 - 8 min read
Read article Read articleJuly 24, 2026 - 11 min read
Read article Read article