A buyer-journey map is a visual, evidence-backed model that shows how your target accounts and buying committee actually move from problem recognition to renewal — and it must enable predictable account progression with measurable stage transitions, not just tell a pretty story. Here’s how to start this week:
- Scope it first. Pick one ICP segment and one deal archetype (e.g., mid-market SaaS, $80K–$200K ACV). Don’t try to map everything at once.
- Pull the evidence. Go into your CRM and pull 10–15 closed accounts — won, lost, and no-decision. These are your raw material.
- Run multi-role interviews. Select five of those deals and interview 3–5 distinct roles per deal: champion, end user, IT/security, finance, and exec sponsor. Interviewing multiple roles within each deal surfaces the committee dynamics and veto points that single-contact interviews miss.
A usable map has stage definitions with named entry/exit signals, transition criteria tied to CRM fields or intent thresholds, named owners per stage, and at least one measurable KPI per phase. If your map doesn’t have those four things, it’s decoration.
Table of Contents
What is a buyer journey map and when should you build one?
A buyer-journey map documents how a specific ICP account and its buying committee move through evaluation, purchase, onboarding, and renewal. The emphasis in B2B is on account-level motion: multiple stakeholders, overlapping timelines, and role-specific decision criteria. It’s not a persona profile, not a service blueprint, and not a generic funnel slide.
When to build one:
- You’ve entered a new ICP or changed your product motion (e.g., moving from PLG to sales-assisted)
- Deals are stalling at a consistent stage and you don’t know why
- Churn is elevated and post-sale experience is unmapped
- Marketing and sales are arguing about lead quality instead of sharing a common model of how accounts buy
How it differs from related artifacts:
| Artifact |
Core question it answers |
When to use it |
| Buyer-journey map |
How does the account move from problem to renewal? |
Pipeline design, content strategy, RevOps |
| Experience map |
What does the customer feel across all interactions? |
CX and brand programs |
| Service blueprint |
How does our internal process deliver the experience? |
Operations and product |
For enterprise deals with multi-role committees, an account-level map is non-negotiable. For small ACV or pure PLG motions, a contact-level map focused on product activation may be sufficient.
What are the common B2B buyer-journey stages?
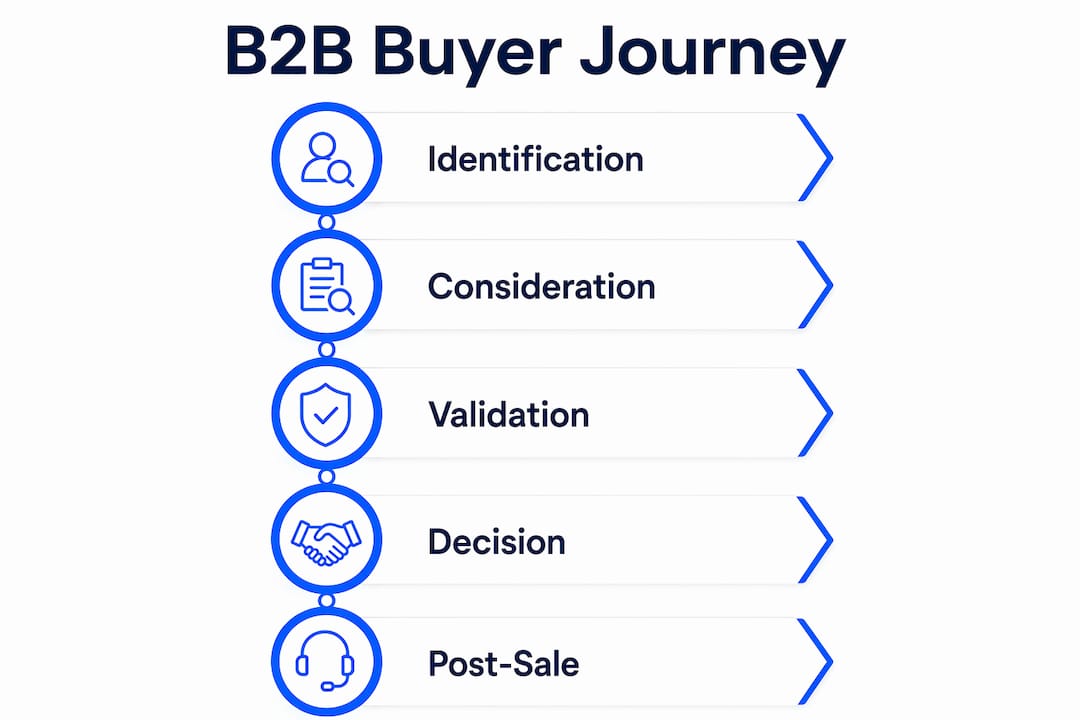
Use this stage model as a starting skeleton, then adjust based on your deal data. The stages below reflect how modern B2B accounts actually behave, including the pre-contact activity most teams miss entirely.
- Stage 0 — Shortlist Formation (Dark Funnel): The buyer is researching before your first touch. They’re reading peer reviews on G2, asking in Slack communities, querying LLMs, and running branded searches. Gartner research confirms that first sales contact occurs well after early shortlist formation. Your signal proxies here: branded search volume, review-site traffic, and LLM mention presence.
- Awareness / Problem Recognition: The account acknowledges a business problem worth solving. Buyer goal: define the problem and scope. Touchpoints: analyst reports, peer referrals, executive podcasts. Exit signal: internal champion assigned, budget conversation started.
- Solution Exploration / Consideration: Active evaluation of categories and vendors. Buyer goal: build a shortlist and understand differentiation. Touchpoints: demo requests, content downloads, sales discovery calls. Exit signal: RFP issued or shortlist confirmed.
- Requirements Building / Validation: The committee aligns on must-haves and runs technical, security, and legal reviews. Buyer goal: reduce risk and build internal consensus. Touchpoints: security questionnaires, reference calls, proof-of-concept. Exit signal: internal approval to proceed.
- Supplier Selection / Decision: Final negotiation and procurement. Buyer goal: get the best terms with minimal risk. Touchpoints: legal review, pricing negotiation, exec alignment. Exit signal: signed contract.
- Onboarding / Usage: The account activates and reaches first value. Buyer goal: prove ROI to internal stakeholders. Touchpoints: kickoff call, implementation support, product training. Exit signal: first-value milestone hit (defined per product).
- Expansion / Renewal / Advocacy: The account grows, renews, or refers. Buyer goal: expand value and justify investment. Touchpoints: QBRs, upsell conversations, case study requests. Exit signal: renewal signed or expansion opportunity created.
Stage complexity scales with deal size. A $15K deal may compress Stages 2–4 into two weeks. A $500K enterprise deal can spend three months in Validation alone. Your B2B sales methodology should reflect that variance.

What fields does a usable journey map need to include?
This is where most maps fail. Teams build a beautiful Miro board with stage names and emoji emotion curves, then never connect it to CRM fields, content owners, or measurable signals. Here’s the checklist that separates operational maps from decorative ones.
Core components every map must have:
- Scope: ICP definition (industry, company size, deal archetype) and the specific motion being mapped (new logo vs. expansion)
- Account-level stages: Named phases with clear definitions, not just labels
- Role-by-role presence: Which stakeholders appear at each stage and what they care about
- Touchpoints: Owned (your content, reps), earned (reviews, referrals), and dark-funnel (peer channels, LLMs)
- Buyer goals and questions: What the account is trying to accomplish and what they need answered at each stage
- Emotions and pain points: Where friction peaks and confidence drops
- Moments of truth: The two or three interactions that most influence the decision
- Transition criteria: Specific, measurable signals that confirm an account has moved to the next stage
- Metrics: At least one KPI per stage that you can track in your CRM or analytics stack
- Ownership / RACI: Named individuals or roles responsible for each stage and transition
Example map field structure:
| Field |
What to populate |
| Phase |
Stage name and definition |
| Actor |
Roles active at this stage (champion, IT, finance, exec) |
| Buyer actions |
What the account is doing (researching, comparing, reviewing) |
| Touchpoints |
Channels and assets in play (demo, security brief, reference call) |
| Transition signals |
CRM flags, intent scores, or behavioral triggers that confirm stage exit |
| Owner |
Marketing, sales, or CS role responsible for this stage |
| Metric |
KPI tracked (e.g., time-in-stage, conversion rate, NPS at onboarding) |
The transition criteria column is the one most teams skip. Without it, stage advancement is based on rep intuition, not evidence — and your pipeline forecast stays unreliable.
Which map type should you build first?
Not all maps serve the same purpose. Picking the wrong type wastes weeks of work.
- Current-state (as-is) map: Documents how accounts actually buy today, warts and all. Build this first. It’s your diagnostic baseline.
- Future-state (to-be) map: Shows the ideal journey after you’ve fixed friction points. Build this after you’ve validated the current-state map with data.
- Purchase journey map: Covers evaluation through contract. Owned primarily by marketing and sales. This is the map most teams build.
- Usage / onboarding journey map: Covers activation through renewal. Owned by customer success and product. Purchase and usage journeys are distinct maps with different owners — treating them as one is a common mistake that leaves retention unmapped and churn unexplained.
- Day-in-the-life map: Focuses on a single role’s daily experience. Useful for persona-specific content strategy, not for pipeline design.
- Account-level vs. contact-level: Account-level maps track the committee motion. Contact-level maps track individual persona journeys. Build account-level first, then overlay contact-level personas.
When to use which:
- Reduce churn or improve retention → Usage/onboarding map
- Fix a stalled pipeline stage → Current-state purchase map
- Design a new GTM motion → Future-state map
- Build persona-specific content → Contact-level or day-in-the-life map
- Enterprise deals with 4+ stakeholders → Account-level map, always
How to create an evidence-based buyer-journey map
This is the process. Run it in order. Don’t skip the research phase to get to the Miro board faster.
- Define scope and ICP. Choose one segment: industry, company size, deal archetype, and motion (new logo vs. expansion). Trying to map all segments at once produces a map no one uses.
- Pull deals and segment by outcome. Extract 10–15 closed accounts from your CRM — split by won, lost, and no-decision. Tag each with deal size, sales cycle length, and number of stakeholders involved.
- Run multi-role interviews. For five of those deals, interview 3–5 distinct roles per account. Include champions, end users, gatekeepers, and — critically — buyers from lost and no-decision deals. These interviews surface governance blockers and missing approver buy-in that analytics will never show you.
- Reconstruct account-level timelines. Use CRM opportunity timelines, call transcripts, and intent data to rebuild the actual sequence of events for each account. Map when each stakeholder engaged, what content they consumed, and where momentum stalled.
- Synthesize patterns and draft the map. Look for where won deals diverge from lost ones. That divergence is your highest-priority insight. Draft stage definitions based on patterns, not assumptions.
- Define transition criteria and measurement. For each stage exit, define a specific, measurable signal. “Champion confirmed” is not a signal. “Champion sent internal summary email and requested pricing” is.
- Assign owners and quick experiments. Use a simple RACI: who owns content at each stage, who tracks signals, who advances the account. Then pick one stalled stage and design a quick experiment to fix it.
- Present and socialize the map. Run a 120-minute cross-functional workshop with 6–12 participants from marketing, sales, product, and CS. Validate the draft, surface emotion-curve pain points, and get named owners to commit.
Prioritization: Use an ICE score (Impact × Confidence × Ease) to rank which stages or pain points to fix first. Don’t try to fix everything. Pick the top three.
Realistic timeline: A v1 map for one ICP segment takes 30–45 days: two weeks for deal pull and interviews, one week for synthesis, one week for workshop and socialization. Plan for a 60-day iteration cycle after that.

Pro Tip: Recruit interview participants from your CRM using deal stage and outcome as filters. Prioritize no-decision buyers — they’ll tell you about the governance blocker or missing stakeholder that your won-deal interviews will never mention.
What research methods and data sources build the best map?
The map is only as good as the evidence behind it. Here’s how to balance qualitative and quantitative signals.
Qualitative vs. quantitative — what each proves:
| Method |
What it reveals |
Limitation |
| Buyer interviews (won/lost/no-decision) |
Motivations, friction, governance blockers, emotional triggers |
Small sample; recall bias |
| CRM opportunity timelines |
Actual stage durations, deal velocity, stakeholder sequence |
Only captures what reps logged |
| Call transcripts / recordings |
Objections, questions, language buyers use |
Requires tagging and analysis time |
| Intent data (Bombora, G2, etc.) |
Pre-contact research behavior, topic interest |
Probabilistic; not buyer-confirmed |
| Session replay and analytics |
On-site behavior, content consumption patterns |
Shows what, not why |
| Surveys / voice-of-customer |
Scaled sentiment, satisfaction, feature priorities |
Surface-level without follow-up |
| Branded search trends |
Stage 0 shortlisting activity |
Indirect proxy only |
| Peer communities / review sites |
Dark-funnel conversations, shortlist criteria |
Hard to attribute to specific accounts |
Behavioral analytics paired with voice-of-customer signals produce the most complete picture. Analytics show you where buyers drop off; interviews tell you why.
Sample multi-role interview questions (five-act structure):
- Context: “Walk me through what triggered the search for a solution like ours.”
- Process: “Who else was involved, and how did each person influence the decision?”
- Evaluation: “What were your must-haves vs. nice-to-haves when comparing options?”
- Friction: “Where did the process slow down or almost fall apart? What caused it?”
- Outcome: “Looking back, what would have made the decision easier or faster?”
Sample sizes: Target 8–12 buyers across won, lost, and no-decision outcomes. In B2B, interview 3–5 roles per deal to reach the insight density needed to map committee dynamics accurately. A single contact per deal leaves veto stakeholders invisible.
Pro Tip: When interviewing committee members from the same deal, do it separately. Group interviews produce social-desirability bias. Individual sessions surface the real friction — especially from stakeholders who were skeptical or nearly killed the deal.
B2B-specific mapping: committees, Stage 0, and the account-first approach
Most journey maps fail in B2B because they’re built for a single persona. Real B2B buying involves 4–10+ stakeholders, each with different evaluation criteria, different risk tolerances, and different moments of truth.
Buying-committee mapping by stage:
- Stage 0–Awareness: Champion and end user (self-directed research, peer channels)
- Consideration: Champion, end user, and sometimes IT (demo, discovery)
- Validation: IT/security, legal, finance, and exec sponsor (security review, business case, procurement)
- Decision: Exec sponsor and procurement (final approval, contract)
- Onboarding: Champion, end user, and CS team (activation, training)
- Expansion: Champion, exec sponsor, and CS (QBR, upsell)
Build a stakeholder-stage matrix as a separate artifact. Rows are roles; columns are stages. Mark where each role is active, what they need, and who owns the relationship.
Stage 0 and dark-funnel visibility. By the time a buyer fills out your demo form, they’ve often already set their shortlist. Gartner research confirms that first sales contact happens well after early shortlist formation. To detect Stage 0 activity, track branded search volume, G2 and Capterra profile visits, LLM mention presence, and activity in relevant Slack communities or LinkedIn groups.
Account-level first, contact-level second. Build the account-level map using CRM data and closed-deal interviews. Then overlay contact-level persona journeys for each role. This sequence matters because account-level patterns reveal committee dynamics that persona-level maps hide.
Handoff checklist across teams:
- Marketing → Sales: What signals trigger an MQL? Who notifies the AE and what context do they pass?
- Sales → CS: What’s in the handoff document? Who owns the first 30 days?
- CS → Sales (expansion): What usage signals trigger an expansion conversation? Who owns the QBR?
How do you measure whether the journey map is working?
A map without a measurement layer is a story. Here’s how to instrument it so it drives pipeline outcomes.
KPI mapping by stage:
- Stage 0: Branded search share, G2 profile views, review-site traffic
- Awareness → Consideration: MQL-to-SQL conversion rate, time-to-first-meeting
- Consideration → Validation: Demo-to-proposal conversion, number of stakeholders engaged
- Validation → Decision: Time-in-stage, security review completion rate
- Onboarding: First-value time, 30/60/90-day NPS, onboarding completion rate
- Expansion: Net revenue retention, expansion pipeline created, QBR completion rate
Connect these KPIs to your sales funnel metrics in your RevOps dashboard. Stage transitions should trigger CRM actions automatically where possible.
Three experiment examples:
- Fix a Validation stall: Create a security brief and IT FAQ that the champion can share internally. Measure reduction in time-in-stage for deals with active IT stakeholders.
- Shorten Consensus Creation: Build an executive summary kit for champions to present to their exec sponsor. Measure increase in exec-sponsor engagement rate and deal velocity.
- Improve 90-day retention: Add a structured 30-day check-in call with a defined success milestone. Measure 90-day NPS and first-value time.
Governance cadence:
- Monthly: Review stage conversion rates and time-in-stage against baseline
- Quarterly: Run a map iteration session with marketing, sales, and CS
- Annually: Full map rebuild for each ICP segment, incorporating new deal data
Teams that connect journey analytics to revenue outcomes consistently outperform teams that track satisfaction metrics alone. The map earns its keep when it changes what reps do in a specific stage — not when it looks good in a slide deck.
You don’t need expensive software to ship a v1 map. You need the right templates and a clear tool stack.
Template types to build or download:
- Account-level map template: Columns for stage, actor, buyer actions, touchpoints, transition signals, owner, and metric
- Stakeholder-stage matrix: Rows for roles, columns for stages, cells showing presence and needs
- Multi-role interview guide: Five-act structure with role-specific question variants
- Experiment brief: Hypothesis, owner, metrics, required assets, and timeline
**
Tool categories by function:
- CRM (Salesforce, HubSpot): Opportunity timelines, stage data, closed-deal segmentation
- Intent platforms (Bombora, G2 Buyer Intent): Stage 0 and dark-funnel signals
- Session replay and analytics (Hotjar, FullStory, GA4): On-site behavior and content consumption
- Survey and interview tooling (Typeform, Gong, Chorus): Voice-of-customer and call analysis
- Visualization boards (Miro, Mural, Lucidchart): Map drafting, workshop facilitation, and stakeholder collaboration
Pick one tool per category and connect them. A Miro board that’s never updated because it’s disconnected from Salesforce is just expensive decoration.
How do you turn the map into real change across teams?
Mapping is the research phase. Operationalizing is where the revenue impact happens. Most teams stop at the map.
Prioritization template: Score each identified pain point or stage gap on Impact (1–10), Confidence (1–10), and Ease (1–10). Multiply the three scores. Run the top three experiments first. Don’t debate the list — ship the experiments and let data decide.
Sample 8–12 week experiment brief:
- Owner: Named individual (not a team)
- Hypothesis: “If we give champions an exec summary kit before the Validation stage, we’ll reduce time-in-stage by 20% within 60 days.”
- Metrics: Time-in-stage (primary), exec-sponsor engagement rate (secondary)
- Required assets: One-page exec summary template, champion enablement email sequence
- Review date: Week 8
Change management notes. The map dies if no one owns it. Assign a named map owner (usually RevOps or a senior marketing leader). Set a monthly review tied to your pipeline review cadence. When an experiment produces a result, update the map immediately. When a new deal pattern emerges from CRM data, flag it in the next quarterly session. Keeping momentum through long buying cycles requires the map to stay current, not become a historical artifact.
What does buyer-journey mapping actually deliver?
Real talk: the ROI of mapping is not in the map itself. It’s in what the map changes.
Teams that build evidence-based journey maps with measurement layers see three categories of improvement. First, conversion lift at specific stages — because you’ve identified the exact friction point and built an asset or process to address it. Second, retention improvement — because the usage/onboarding journey is now mapped, owned, and measured, instead of assumed. Third, team alignment — marketing, sales, and CS stop arguing about lead quality and start sharing a common model of how accounts buy and what each team is responsible for at each stage.
The alignment benefit is often underestimated. When marketing knows which content assets are needed at the Validation stage, they build them. When sales knows which stakeholders need to be engaged before the Consensus Creation stage, they engage them proactively. When CS knows what “first value” looks like for a specific ICP, they can measure and accelerate it. Structure beats heroics, every time.
How do you keep the map accurate after you launch it?
A journey map has a shelf life. Buyer behavior shifts, your product changes, and new competitors enter the market. Here’s how to keep the map from going stale.
Validation techniques post-launch:
- Quarterly win/loss review: Pull five new closed deals each quarter and check whether the patterns match the map. If three of five won deals show a new stakeholder appearing at Validation, update the map.
- Stage conversion monitoring: If a stage’s conversion rate drops by more than 10–15% over two consecutive months, treat it as a signal that the map no longer reflects reality.
- Champion feedback loops: Build a structured 90-day post-close survey into your CS process. Ask buyers to describe the decision process in retrospect. Patterns from these surveys often surface map gaps.
- Rep calibration sessions: Monthly 30-minute sessions where AEs share one deal that didn’t follow the expected map. These sessions surface edge cases and emerging patterns faster than any analytics tool.
The map is a living model, not a deliverable. Treat it like your CRM: it’s only useful if it’s current.
How should marketing and sales collaborate during the mapping process?
The biggest reason journey maps fail isn’t bad research. It’s that marketing built the map and sales never adopted it, or sales built it and marketing ignored it. Collaboration has to be structural, not aspirational.
Practical collaboration structure:
- Joint kickoff: Marketing and sales leaders align on scope, ICP, and success criteria before any research starts. If they can’t agree on the ICP, the map will reflect that disagreement.
- Shared interview pool: Marketing recruits interview participants; sales provides access and context. Both teams review transcripts together. This creates shared ownership of the findings.
- Cross-functional synthesis workshop: Use the 120-minute workshop format with 6–12 participants. Include at least two AEs, two marketers, one CS leader, and one RevOps representative. The goal is a validated draft map with named owners, not a perfect document.
- Stage-specific content ownership: For each stage, marketing owns the content assets and campaign signals; sales owns the stakeholder engagement and CRM updates. Document this in the RACI and review it monthly.
- Shared KPIs: Both teams are measured on stage conversion rates, not just MQLs or closed-won revenue. Shared metrics create shared accountability.
The HubSpot 8-step approach to B2B journey mapping explicitly includes cross-functional alignment as a core step — and for good reason. A map that only one team believes in will never change pipeline outcomes.
Key Takeaways
An evidence-based buyer-journey map drives predictable pipeline outcomes only when it includes account-level stage definitions, measurable transition signals, named owners, and a measurement layer connected to your CRM.
| Point |
Details |
| Start with closed deals |
Pull 10–15 won, lost, and no-decision accounts from CRM before drafting any stage. |
| Interview multiple roles |
Interview 3–5 distinct roles within each deal to surface committee dynamics and veto points. |
| Define transition signals |
Every stage exit needs a specific, measurable CRM flag — not a rep’s gut feeling. |
| Separate purchase and usage maps |
Onboarding-to-renewal is a distinct journey with different owners; map it separately. |
| Saleslabelconsulting accelerates this |
Saleslabelconsulting runs sales audits and journey mapping engagements that connect maps to CRM triggers and pipeline outcomes. |
The map is not the problem — the measurement layer is
Here’s the honest take: most B2B teams don’t have a mapping problem. They have a measurement problem. They build a map, run a workshop, get everyone nodding in the room, and then nothing changes in the CRM, nothing changes in the content calendar, and six months later the Miro board is a historical artifact.
The fix isn’t a better template. It’s treating the transition criteria column as the most important part of the map. If you can’t define a specific, observable signal that confirms an account has moved from Consideration to Validation, you don’t actually understand your buying process yet. That’s the real diagnostic.
Three quick wins you can run in the next two weeks without a full mapping project: First, pull your last 10 closed-lost deals and look for the stage where they stalled. That single pattern will tell you more than a month of workshops. Second, build a one-page consensus kit for your champions — a document they can share internally to build exec buy-in. Measure how many deals with that kit advance past Validation versus those without. Third, push branded search and review-site presence for your primary ICP. Stage 0 buyers are researching before you know they exist; showing up in that research changes your shortlist rate.
Maps that aren’t connected to measurement are just stories. Stories don’t close deals.
Saleslabelconsulting turns your buyer-journey map into a pipeline system
Most teams finish a mapping project with a great Miro board and zero change in their CRM. Saleslabelconsulting closes that gap. We run structured sales audits that identify exactly where your pipeline stalls, then build the transition signals, content assets, and RevOps triggers that make the map operational.
Our engagements cover the full mapping-to-execution cycle: ICP scoping, multi-role buyer interviews, account-level map design, CRM instrumentation, and sales enablement frameworks that give your reps the right asset at the right stage. If your deals are stalling in Validation or your onboarding journey is unmapped and churn is climbing, a sales audit is the fastest way to find the blockage and fix it. Book a diagnostic call with Saleslabelconsulting and leave with a prioritized list of the three highest-leverage changes you can make to your pipeline this quarter.
Useful sources and further reading
- B2B Buyer Journey Research: How to Map the Modern Buying Committee — Practitioner guide on committee-aware mapping, Stage 0 detection, and multi-role interview methodology. Particularly useful for understanding dark-funnel proxies and why single-contact interviews miss veto stakeholders.
- B2B Customer Journey Mapping: A Step-by-Step Guide | ObserviX — Detailed operational guide covering account-level map construction, transition criteria design, and how to connect journey analytics to revenue outcomes. The measurement-layer guidance here is the most practical available.
- Customer Journey Mapping: Definition, Methodology, Workshop Guide & B2B Example | SI Labs — Covers the 120-minute workshop protocol, the distinction between purchase and usage journeys, and why committee maps require separate treatment from single-persona maps.
- Creating a B2B Buyer Journey Map in 8 Steps | HubSpot — A repeatable 8-step framework covering persona definition, touchpoint inventory, gap analysis, and governance. Good starting template for teams new to structured mapping.
- Customer Behavior Analysis: Know Why They Buy | Birdeye — Explains how to combine behavioral analytics with voice-of-customer signals to understand the motivations behind buyer actions, not just the actions themselves.
- What Is a Customer Journey Map? Examples & Process | HBS Online — Harvard Business School’s foundational overview of journey mapping methodology, useful for grounding the practice in academic and practitioner consensus.
- Saleslabelconsulting — Sales Ops & Revenue Optimization — Service page for sales audit, journey mapping, and RevOps engagements. Includes templates and diagnostic resources for teams ready to operationalize their maps.
Recommended