
Stop Using 3x: Calculate Your Real Pipeline Coverage for RevOps
Your required pipeline coverage is roughly 1 divided by your historical win rate, not a fixed multiple copied from someone else’s deck. Adjust that baseline for your segment, deal size, and how much of your pipeline is actually still breathing.
TL;DR:
- Most teams should base their pipeline coverage target on the inverse of their own win rate, adjusted for segment, deal size, and pipeline health.
- Raw coverage counts total open pipeline dollars, while weighted coverage accounts for deal stage probability, making the latter a more accurate forecast indicator.
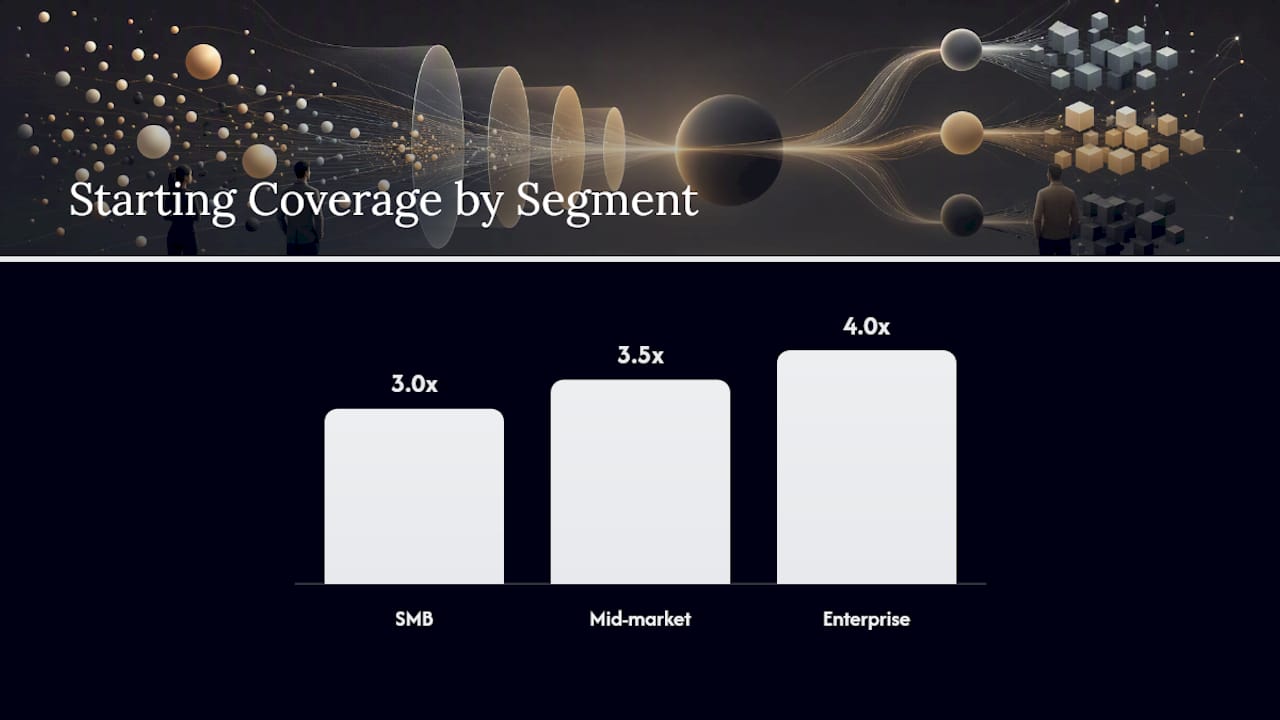
- A typical coverage ratio at quarter start is around 3x for SMB, 3.5x for mid-market, and 4x for enterprise, but these should be adjusted for actual win rates.
- Falling below checkpoints in weekly coverage, especially near quarter end, indicates stalled deals, poor pipeline generation, or overestimated deal progress.
- Valid pipeline audits check recency of activity, discovery quality, stakeholder mapping, and limited date shifting, not just deal volume.
A pipeline coverage benchmark is a target ratio of open pipeline value to quota, used to judge whether a rep, team, or region has enough in-flight opportunity to hit their number. That’s the textbook version. In reality, the number only means something once you know what’s feeding it.
There are two ways to calculate coverage, and confusing them is where most RevOps teams get burned.
Raw coverage tells you how much pipeline exists. Weighted coverage tells you how much of it you should actually bank on.
The pipeline coverage ratio isn’t an arbitrary sales tradition. It’s a straightforward inversion of your own conversion math.
Walk through a worked example. That means they need roughly $900,000 in qualified, in-quarter pipeline. If their CRM shows $950,000 in raw pipeline but weighted value comes in at $310,000, something’s off. This is exactly why leaders who only track pipeline visibility at the raw level get blindsided in week 10.
Quarter-start benchmarks cluster in predictable bands, but they’re starting points, not laws of physics. Industry data puts SMB coverage near 3x, mid-market near 3.5x, and enterprise near 4x at the start of a quarter, scaled to typical win rates in each segment.
Here’s how those bands break down and why they shift:
Those bands assume “typical” win rates for each segment. Your team’s actual number could sit well outside that range, and when it does, the segment benchmark is the wrong number to chase. A team with a 21% blended win rate needs closer to 5x coverage than 3x, and some benchmark analyses argue the popular 3x rule is systematically low for exactly this reason. The fix is simple math: take your own win rate, invert it, and use that instead of the shorthand.
Quick Stat: Coverage bands decay predictably through the quarter. Starting benchmarks fall from roughly 3.0x to 1.0x by week 13 for SMB, 3.5x to 1.2x for mid-market, and 4.0x to 1.5x for enterprise, as deals close and pipeline gets consumed.
That decay curve gives you three natural checkpoints to build into your weekly rhythm:
Falling meaningfully below any of these checkpoints doesn’t just mean “work harder.” It usually means new pipeline generation has stalled, deals have stacked up in early stages without progressing, or reps are sandbagging updates instead of disqualifying dead opportunities.
Channel-led, product-led growth, and expansion motions all bend these numbers further. Channel pipeline tends to convert at lower rates because partners qualify less rigorously, so push required coverage higher. PLG-sourced pipeline often converts faster and cheaper once a usage signal is present, which can justify running leaner coverage on those segments. Expansion and upsell pipeline, sourced from existing customers, usually closes at much higher rates than new logo pipeline, so blending it into one company-wide coverage number distorts both halves.
Raw coverage is a volume metric. It counts dollars, not deal health, and pipeline coverage alone says nothing about whether that pipeline is real. Three distortions inflate raw coverage without adding a dollar of real forecast:
Each of these leaves fingerprints in your CRM. Stale deals show up as long gaps since last activity. Stage stuffing shows up as deals in late stages with thin or missing discovery notes and no multi-threaded contacts. Date shifting shows up as a close date that’s been edited more than once or twice.
Before trusting a coverage number, check for these signals:
Pro Tip: Build a saved CRM view that flags any open deal with no activity in 60+ days and stack rank it by amount. Review that list every Monday before your pipeline meeting, not after. Deals that survive two consecutive weekly reviews without new activity get disqualified by default, not by debate.
Coverage isn’t a number you check once at kickoff. It’s a curve, and the shape of that curve tells you whether you’re on pace or quietly falling behind.
Early in the quarter, coverage should sit at or above your win-rate-adjusted target, since you haven’t consumed any of it yet. By mid-quarter, coverage naturally drops as deals close and move out of the “open” bucket, but new pipeline created that period should be backfilling a meaningful share of what left.
Monitoring cadence should mirror that curve:
Coverage alone doesn’t tell the full story on a dashboard, so pair it with pipeline velocity (average days per stage), age distribution (share of pipeline over 30, 60, and 90 days old), and new pipeline created per week. A team can have healthy coverage and still miss quota if velocity has slowed or if all the new pipeline is landing in early stages that won’t mature in time.
Capacity is the other half of the equation that raw ratios ignore; exploring AI for operational scaling can help optimize capacity and enablement. A newly ramped rep carrying the same coverage target as a tenured rep is set up to fail, because ramped reps typically need more pipeline per dollar of quota to hit the same number while they’re still building qualification instincts. Factor ramp status into individual coverage targets rather than applying one blanket multiple across a team with mixed tenure.
Most coverage problems trace back to one of three root causes, and figuring out which one you have determines what you fix first. Run this triage before you touch headcount or comp plans.
Quantity problem: raw coverage itself is below your win-rate-adjusted target. You simply don’t have enough deals in the pipeline, full stop.
Quality problem: raw coverage looks fine, but weighted coverage or your stale-deal audit says much of it isn’t real. You have volume without substance.
Capacity problem: coverage looks adequate on paper, but reps don’t have the bandwidth to work it properly, so deals stall from neglect rather than disqualification.
Once you know which problem you’re solving, prioritize fixes in this order.
Priority 1, fix the pipeline you already have. Purge or downgrade any deal with no activity past 90 days. Tighten qualification gates so deals can’t advance stages without discovery evidence and a mapped stakeholder. Roll out opportunity scoring so reps and managers agree on what “healthy” looks like at each stage, instead of relying on gut feel.
Priority 2, fill the specific gaps you found. If the shortfall is concentrated in late-stage pipeline, targeted outbound aimed at your best-fit accounts closes that gap faster than generic top-of-funnel volume. If certain reps are overloaded relative to their coverage, reassign accounts or opportunities rather than asking an already-stretched rep to somehow generate more. Equip sellers with battlecards and objection-handling material tied to the specific stages where deals are stalling, not generic product collateral.
Pro Tip: Before running any fix company-wide, pilot it on a single team or region for one full cycle and compare the forecast delta against a control group. This is the cheapest insurance against making a headcount or process decision based on one noisy quarter.
We built our benchmarking process around one belief: a coverage number is only as good as the audit behind it. That’s the whole premise of sales pipeline optimization built for predictable revenue, and it starts with a repeatable sequence rather than a gut-check.
The steps we run with revenue teams look like this:
We also lean on standing playbooks that teams can adopt without reinventing them: a seven-day lead response SLA, an MQL-to-SQL qualification playbook, and opportunity scoring templates that plug directly into most CRMs.
If your team can pull clean CRM exports and has an analyst who can run the win-rate math, you can DIY most of this in an afternoon. If your data is scattered across systems, your stage definitions are inconsistent across teams, or leadership can’t agree on what “qualified” means, that’s usually the signal to bring in outside help for a structured revenue audit.
Here’s what benchmark reports never say out loud: leaders don’t fail at coverage because they don’t know the formula. They fail because fixing coverage properly means short-term pain that competes directly with this quarter’s number. Purging stale deals drops your raw coverage immediately, right when a VP wants to see it going up. Tightening qualification gates slows down how fast reps can log a deal, right when you need velocity. Every real fix has a cost that shows up before the benefit does.
The leaders who get this right don’t chase a perfect benchmark. They run small experiments, one team, one quarter, measured against a control group, and let the forecast delta make the case for scaling. A two-hour diagnostic and one pilot fix beat a borrowed benchmark every time.
— Antony
Most teams don’t need another dashboard. They need someone to tell them, plainly, whether their coverage number is real. Some revenue audits pair the win-rate inversion math in this guide with a hands-on quality and capacity check on your actual CRM data, not a generic template pulled from a slide deck.

If you’ve read this far and you’re already suspicious that your coverage number is padded with stale deals or stage stuffing, that instinct is probably right. Our sales enablement services built for predictable revenue walk your team through the same segmental win-rate math, quality audit, and capacity check described above, then help you build the qualification gates and scoring rubric to keep coverage honest going forward. Consider booking a short diagnostic session to help determine whether a pipeline problem is quantity, quality, or capacity related, before making a headcount decision based on a potentially unreliable number.
Divide total open pipeline value with in-quarter close dates by your quota for raw coverage, or use stage-weighted deal values for weighted coverage. Weighted coverage is the more reliable number once you’re past week one of the quarter.
Coverage ratio equals open pipeline value divided by quota. Required coverage, the target you should aim for, equals 1 divided by your historical win rate.
It measures whether you have enough open opportunity in motion to hit quota, assuming a portion of that pipeline won’t close. It says nothing about deal quality on its own, which is why pairing it with a stale-deal audit and opportunity scoring matters more than the raw multiple itself.
Rebaseline win rates and coverage targets monthly using the trailing four to six quarters of data, and check the ratio against decay checkpoints weekly. A benchmark built once at the start of the year and never revisited will quietly go stale, the same way pipeline does.
Subscribe to our Insights: Expert productivity tips in your inbox
You'll receive 1-3 emails per month. Your data stays private, always.

CRO & Co-Founder with Sales Label Consulting

Watch our Sales Mates Podcast
September 11, 2026 - 11 min read
Read article Read articleSeptember 10, 2026 - 11 min read
Read article Read articleSeptember 9, 2026 - 9 min read
Read article Read articleSeptember 8, 2026 - 7 min read
Read article Read article