
Map Customer Journey for B2B RevOps & Sales Leaders
TL;DR:
- Mapping the customer journey requires defining stages based on buyer actions and validating hypotheses through mixed methods.
- A useful map includes eight key elements—persona, stages, touchpoints, emotion curve, assumptions, evidence, owners, and KPIs—that prevent it from becoming ineffective decoration.
Map the customer journey by defining customer-centered stages, validating a compact hypothesis with mixed-methods evidence, then converting the top moments of truth into owned experiments and KPIs. That’s the repeatable method. Every operational map your team builds needs eight elements to be useful: persona, stages, touchpoints, emotion curve, assumptions, evidence, owners, and KPIs. Miss any one of them and you end up with a wall decoration, not a revenue tool.
The required elements at a glance:
Pro Tip: Label every unvalidated element on your first draft as “Assumption.” This single habit forces honest conversations in workshops and prevents the map from being treated as ground truth before you’ve run a single interview.
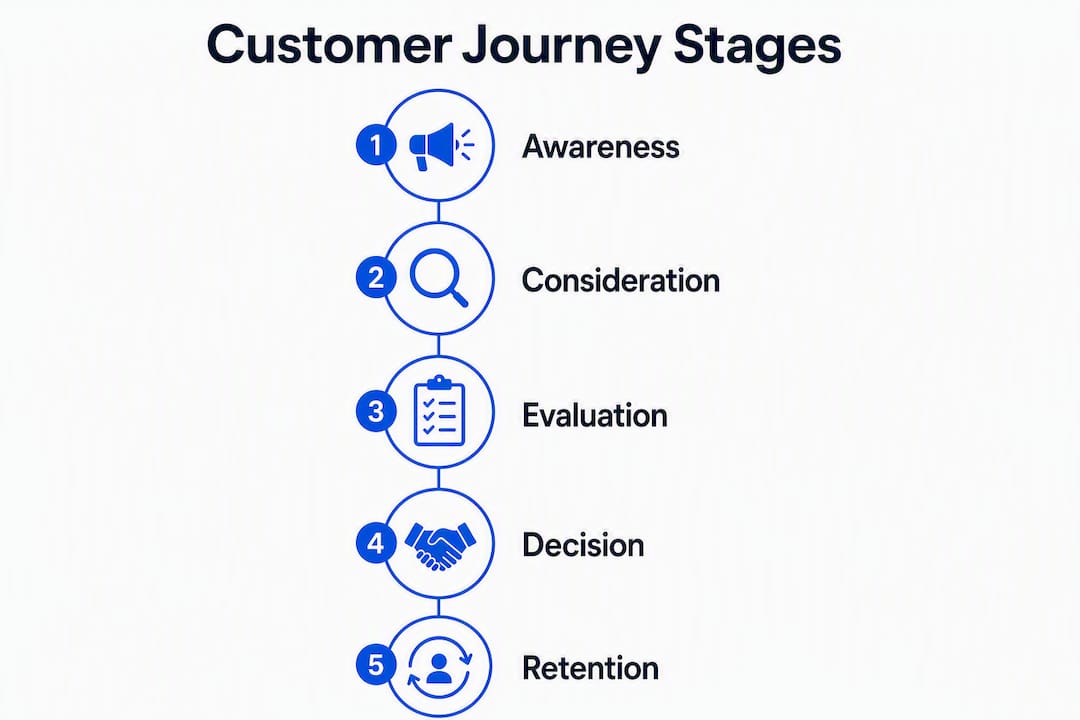
The most common mistake senior leaders make is mapping from internal steps rather than observable customer behavior. “Lead qualification” is a sales action. “Seeking solutions” is what the buyer is actually doing. That distinction matters because customer-framed stages expose touchpoints your team never knew existed.
For B2B tech, a minimal stage set looks like this:
Scope rules: one persona, one primary outcome, and no more than 1–3 sub-paths per map. Start with a high-level master map before drilling into sub-journeys. Cognitive overload kills adoption faster than any data gap.
Pro Tip: Write each stage as a verb phrase the customer would say: “I’m comparing vendors” beats “Evaluation Stage.” It keeps the whole team anchored to the buyer’s reality.
Real talk: a map built from a single team brainstorm is a vanity project. The maps that actually drive pipeline decisions combine qualitative interviews with quantitative CRM sequences.
Your mixed-methods plan:
The interview quality rule: probing follow-up questions that surface verbatim emotional words (“annoyed,” “relieved,” “stuck”) reveal moments of truth more reliably than larger, shallow samples. Depth beats volume every time.
Sample interview prompts:
For data sources, connect all available systems: ad platforms, website analytics, CRM, email, and offline events. Track micro-conversions (content downloads, webinar attendance) that predict final conversions. Pull 60–90 days of conversion data for your top accounts to understand typical touchpoint sequences and time-to-convert.
Pro Tip: AI-moderated voice interviews can run and theme 30–100 conversations in a week, automating probes and thematic coding. Use them to scale coverage when your team can’t conduct every session manually. Marketing analytics tied to journey stages compounds the value of that data significantly.
Raw evidence needs a home. A touchpoint inventory is a structured table that links every customer action to an owned system, a channel, and a metric. Here’s the format:

| Touchpoint | Stage | Channel | Owner | System | Evidence Source | Metric |
|---|---|---|---|---|---|---|
| Paid ad click | Discovery | Google Ads | Marketing | CRM / Attribution | Analytics | CTR, cost per click |
| Product page visit | Discovery | Website | Marketing | Analytics | Heatmap / GA4 | Time on page, bounce |
| Content download | Evaluation | Email / Web | Marketing | Marketing automation | CRM event | Download → demo rate |
| Webinar attendance | Evaluation | Virtual | Demand Gen | Webinar platform | CRM event | Attendance → opp rate |
| Demo call | Evaluation | Video / Phone | Sales | CRM | Call recording | Demo → proposal rate |
| Sales email sequence | Evaluation | Sales | CRM | Sequence analytics | Reply rate, meeting rate | |
| Support ticket | Onboarding | Helpdesk | CS | Ticketing system | CSAT | Resolution time, CSAT |
| Onboarding call | Onboarding | Video | CS | CRM / CS platform | Call notes | Time-to-first-value |
Tag each touchpoint as company-owned (your website, your emails) or customer-owned (G2 reviews, LinkedIn communities, analyst reports). Non-owned touchpoints are where buyers spend significant time during Evaluation and Validation. Ignoring them means your map has a blind spot right where deals are won or lost.
Keep the inventory in a shared CRM object or a linked spreadsheet. Assign one owner per row. Set a quarterly review cadence to sync new data sources. The role of CRM in this workflow is to be the system of record, not just a deal tracker.
Not all friction is equal. The peak-end rule tells us that buyers weight the most intense negative moment and the final experience disproportionately when evaluating your brand. Fix the deepest pit and the end-state before touching anything else.
Use this scoring matrix to rank pain points:
| Pain Point | Frequency (1–5) | Severity (1–5) | Revenue Impact (1–5) | Total Score |
|---|---|---|---|---|
| Demo-to-proposal drop-off | 5 | 4 | 5 | 90–120 |
| Onboarding confusion at week 2 | 4 | 5 | 4 | 8–10 |
| Slow security review response | 3 | 4 | 5 | 12 |
| Webinar → demo conversion gap | 4 | 3 | 3 | 10 |
Combine verbatim emotional words from interviews with quantitative drop-off data from your CRM. When five buyers independently use the word “stuck” at the same stage, and your CRM shows a 40% drop-off at that exact transition, you’ve found a moment of truth. That’s your first experiment.
Pro Tip: Map the emotion curve on a simple 1–5 scale across stages. Any stage scoring 2 or below is a candidate for immediate intervention, especially if it precedes a revenue transition.
Customer feedback loops tied directly to these moments accelerate the identification process and give you a continuous signal, not just a snapshot.
A map without owners is a poster. Here’s how to convert findings into a working plan.
Ownership model: one named owner per pain point. Cross-functional RACI covers execution, but the owner is accountable for the KPI. Stakeholder sign-off is required before any experiment goes live.
KPIs to track per stage:
Pilot roadmap template:
Integrate experiments into your RevOps workflows by building stage gates and automation triggers directly in your CRM. A pilot that lives only in a spreadsheet rarely survives the quarter.
You need five artifacts to run a mapping engagement or workshop:
Workshop agenda (90 minutes):
| Time | Activity | Output |
|---|---|---|
| 90–120 min | Align on scope: persona, outcome, map boundaries | Agreed scope statement |
| 10–30 min | Draft stages as a team (customer language only) | Stage list on whiteboard |
| 90–120 min | Map touchpoints and emotion curve per stage | Hypothesis map draft |
| 90–120 min | Score pain points using the matrix | Prioritized pain point list |
| 90–120 min | Assign owners and agree on interview follow-ups | RACI + next steps |
Participants: 6–12 cross-functional people covering sales, marketing, customer success, RevOps, and product. A 90–120 minute workshop produces a strawman map. Schedule 3–5 customer interviews within two weeks to validate it.
Hand off artifacts to RevOps by tagging each touchpoint in your CRM, linking the one-page map to a Confluence page or CRM record, and setting a quarterly update owner.
Most mapping projects fail for predictable reasons. Here’s what to watch for:
Pro Tip: Get stakeholder sign-off on the hypothesis map before running interviews. It forces alignment on what you’re testing and prevents the map from being rewritten after the fact to match internal preferences. Classic sales mistakes often trace back to exactly this kind of internal bias.
An operational B2B customer journey map requires customer-centered stages, mixed-methods validation, a scored moments-of-truth matrix, and named owners with KPIs before it can drive revenue decisions.
| Point | Details |
|---|---|
| Start with customer language | Label every stage as a buyer action, not an internal process step, to expose real touchpoints. |
| Validate before you commit | Run 3–5 voice interviews and pull 60–90 days of CRM sequences before treating any map as fact. |
| Score moments of truth | Use frequency × severity × revenue impact to rank pain points and pick your first experiment. |
| Assign one owner per pain point | A cross-functional RACI without a single accountable owner produces no action and no KPI movement. |
| Saleslabelconsulting | Provides end-to-end mapping, sales audit, and RevOps integration to turn journey findings into measurable pipeline outcomes. |
Here’s my honest take: off-the-shelf journey map templates are fine for consumer products with short, linear buying cycles. For multi-stakeholder B2B tech deals, they consistently produce maps that look good in a slide deck and do nothing for pipeline.
The problem isn’t the template format. It’s that complex B2B journeys involve 6–10 decision-makers, non-linear paths, and external touchpoints (analyst reports, peer communities, security reviews) that no generic template accounts for. A DIY team working from a template tends to map what they already know, which means the map confirms existing assumptions instead of challenging them.
The evidence-driven, consultative approach forces the uncomfortable questions: Why do deals stall at Validation? What do churned accounts say about onboarding? What does “stuck” actually mean to a VP of Engineering evaluating your product? Those answers don’t come from a Miro board. They come from structured interviews, CRM sequence analysis, and a facilitator who knows which assumptions to pressure-test.
When should you hire a consultant versus run an internal pilot? Run the internal pilot first if you have a RevOps lead with bandwidth, a CRM with clean stage data, and at least 30 high-LTV accounts to analyze. Bring in a consultant when the journey spans multiple product lines, the internal team is too close to the process to challenge assumptions, or the first pilot produced a map that no one is acting on.
Most teams finish a mapping workshop with a great artifact and no clear path to revenue impact. Saleslabelconsulting closes that gap. Our engagements cover the full arc: sales enablement design, sales process audit, RevOps integration, and pilot design, so the map becomes a working system with owners, KPIs, and CRM-embedded stage gates.
We work with B2B tech companies where the buying cycle is long, the stakeholder map is complex, and the cost of a stalled deal is high. Our revenue architecture audit identifies the exact moments of truth where your pipeline leaks, and we design the experiments to fix them. No generic playbooks. No templates that don’t fit your motion.
Ready to build a map that actually moves numbers? Book a discovery call with the Saleslabelconsulting team and we’ll scope the right engagement for your stage and team size.
The research behind this article draws on a focused set of authoritative sources:
Recommended next steps:
Subscribe to our Insights: Expert productivity tips in your inbox
You'll receive 1-3 emails per month. Your data stays private, always.

CRO & Co-Founder with Sales Label Consulting

Watch our Sales Mates Podcast
August 24, 2026 - 8 min read
Read article Read articleAugust 23, 2026 - 11 min read
Read article Read articleAugust 22, 2026 - 8 min read
Read article Read articleAugust 21, 2026 - 7 min read
Read article Read article