
Why Track Sales Conversion: A Revenue Leader’s Guide
TL;DR:
- Tracking sales conversion at every stage reveals where prospects drop off and enables targeted improvements that increase revenue. Most teams focus on activity metrics instead of actual stage-to-stage conversions, which leads to missed opportunities and revenue leaks. Implementing cohort-based tracking, integrating data sources, and acting on early signals can turn funnel visibility into predictable sales growth.
Sales conversion tracking is the process of measuring how leads progress through each stage of your sales funnel so you can identify exactly where revenue is being lost and fix it. Without this visibility, your team is flying blind. You might be generating plenty of leads while quietly hemorrhaging deals at the demo stage, the proposal stage, or somewhere in between. The importance of sales conversion tracking goes beyond reporting. It’s the operational foundation for every smart decision a sales leader makes, from coaching reps to setting quotas to forecasting the quarter. Tools like CRM systems, Fullcast, and Cometly exist precisely because this data is that consequential.
The single most powerful reason to track sales conversion is that it turns a vague revenue problem into a specific, solvable one. When you only measure total closed revenue, you see the outcome but not the cause. Stage-by-stage tracking shows you exactly where prospects stall or drop off, which is the difference between guessing and knowing.

Consider the compounding effect. According to Fullcast, improving 5% at three consecutive funnel stages compounds revenue gains far beyond what simple addition would suggest. A 5% lift at each stage of a five-stage pipeline can nearly double your overall conversion rate. That’s not a marginal gain. That’s a structural shift in how much revenue your existing pipeline produces.
Here’s what stage-level tracking actually gives you:
Pro Tip: Don’t wait for a missed quarter to start tracking stage conversion. Root causes of missed sales quarters often surface 60 to 90 days earlier in the conversion data, according to RevenueTools. By the time revenue misses, the window to intervene has already closed.
Conversion doesn’t happen at a single event. It happens across multiple funnel stages, each with its own optimization opportunity. That’s the mindset shift that separates reactive sales teams from predictable revenue machines.
Getting the measurement right matters as much as deciding to measure. Sloppy tracking produces misleading numbers that drive bad decisions.
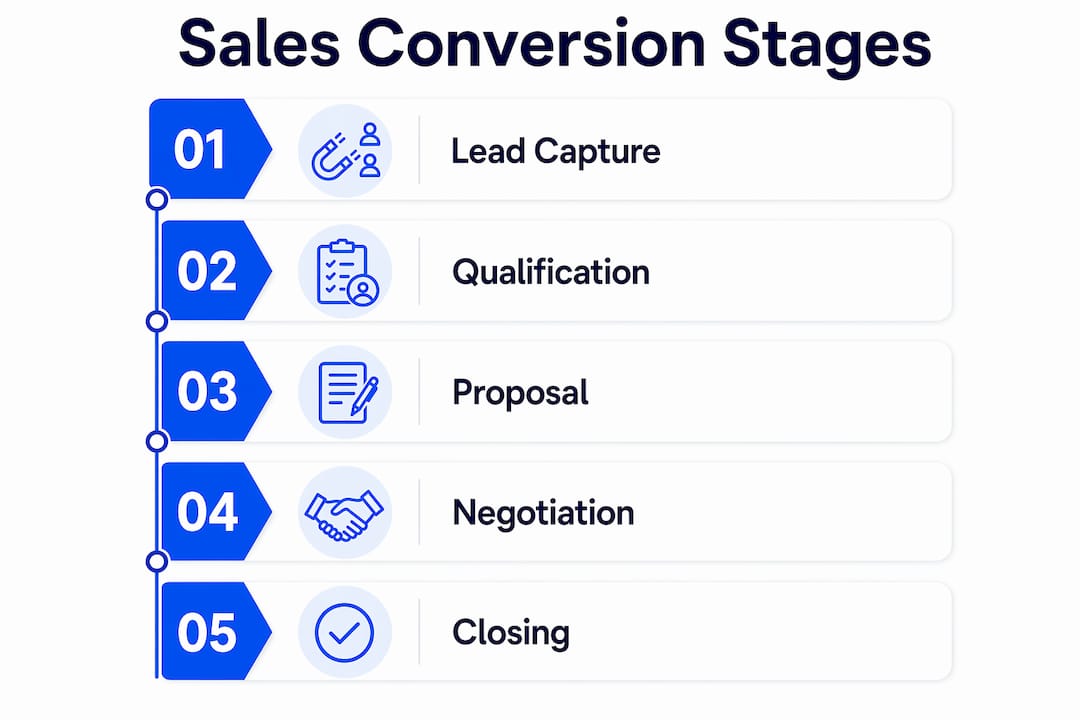
Start by defining conversion as a business-relevant stage exit. The standard transitions to track are:
Next, choose the right measurement method. Most CRM pipeline reports use snapshot metrics, which count deals in each stage at a point in time. The problem is that snapshot metrics can hide true conversion performance. Cohort-based conversion tracking follows a specific group of leads from entry to exit over a defined period, giving you an accurate picture of actual progression. Use cohort analysis for strategic decisions and snapshots for weekly pipeline reviews.
| Measurement method | Best used for | Key limitation |
|---|---|---|
| Snapshot metrics | Weekly pipeline reviews, rep check-ins | Hides true conversion trends over time |
| Cohort-based tracking | Quarterly strategy, forecasting, coaching | Requires clean historical CRM data |
| Source-level tracking | Marketing budget allocation | Needs CRM and ad platform integration |
The third piece is integration. Connecting CRM data with marketing platforms closes the loop from lead source to closed revenue. Instead of reporting cost-per-lead, you can report cost-per-pipeline and cost-per-closed revenue. That’s the number that actually tells you whether your marketing spend is working.
Pro Tip: Calculate your baseline conversion rate manually before trusting any automated report. Divide closed-won deals by total leads entered in the same cohort period. If your CRM number differs significantly, you have a data quality problem to fix before making any strategic decisions.
Real talk: most sales teams think they’re tracking conversions when they’re actually tracking activity. There’s a meaningful difference, and the gap between the two costs revenue.
The most common obstacles include:
Real talk: The fix isn’t buying another tool. It’s auditing what you already have. Map every stage in your funnel, identify where data breaks down, and close those gaps with server-side tracking and first-party CRM data before adding complexity.
Server-side tracking and first-party data are the practical solutions here. When conversion signals are sent from your server rather than a browser pixel, they aren’t blocked by privacy settings. Combined with a well-maintained CRM, this approach gives you a connected conversion tracking system rather than a collection of isolated reports that contradict each other.
Conversion data is only valuable when it changes behavior. Here’s how high-performing sales organizations actually use it.
Coaching with specificity. Conversion rate visibility allows leaders to focus coaching on the largest bottlenecks revealed by stage drop-offs. If your team’s average SQL-to-opportunity rate is 35% but one rep is at 18%, that’s a targeted coaching conversation, not a general training session. You know exactly what to work on.
Territory and quota design. Territories with unequal pipeline capacity produce unequal conversion rates, even among equally skilled reps. Use conversion data by territory to identify structural disadvantages before attributing performance gaps to individual effort. This is where RevOps and sales leadership need to work from the same numbers.
Lost deal analysis. Tracking lost deal reasons in your CRM yields direct insight into where your sales approach or pricing breaks down. If 40% of lost deals cite pricing as the reason, that’s a product positioning or qualification problem, not a closing problem. Act on the pattern, not the individual loss.
Forecasting with confidence. Stage conversion rates are leading indicators that surface performance problems early, not just lagging outcome reports. When your MQL-to-SQL rate drops two weeks in a row, you know the forecast is at risk before the pipeline report shows it. That’s the kind of early warning system that lets you course-correct instead of explain.
Pro Tip: Set CRM alerts for deals that haven’t advanced in 14 days. Stalled deals are a conversion problem hiding in plain sight. Catching them early reduces lead leakage and keeps your pipeline health metrics honest.
Cross-functional alignment is the multiplier here. When marketing, sales, and RevOps all work from the same conversion metrics, you eliminate the blame game. Marketing stops optimizing for lead volume. Sales stops complaining about lead quality. RevOps can audit the sales process and show exactly where the system breaks down with data rather than opinion.
The sales pipeline health of your organization is a direct reflection of how well you’re tracking and acting on conversion data at every stage.
Tracking sales conversion at every funnel stage is the most cost-effective lever for revenue growth because it reveals exactly where deals are lost and enables targeted fixes that compound across the pipeline.
| Point | Details |
|---|---|
| Stage-level tracking reveals bottlenecks | Identify the exact funnel stage where prospects drop off and prioritize fixes there first. |
| Compounding improvements multiply revenue | A 5% gain at each stage of a five-stage pipeline can nearly double your overall conversion rate. |
| Cohort tracking beats snapshot metrics | Use cohort-based analysis for forecasting and strategy to avoid misleading point-in-time data. |
| Conversion optimization beats lead volume | Improving conversion is 3 to 5 times more cost-effective than buying more leads when budgets tighten. |
| Unified data enables cross-functional action | Connecting CRM, marketing, and analytics data shifts reporting from cost-per-lead to cost-per-revenue. |
Here’s my honest take after working with dozens of sales organizations: the problem isn’t that teams don’t track conversion. It’s that they track the wrong version of it.
I’ve seen VP of Sales dashboards full of activity metrics. Calls made, emails sent, meetings booked. All of it looks healthy right up until the quarter misses. The real signal was buried in the stage-to-stage conversion data that nobody was reviewing consistently.
The teams that build predictable revenue don’t have more leads. They have better visibility into what happens to the leads they already have. They know their MQL-to-SQL rate by rep, by channel, and by month. They act on a 3-point drop in that rate the same week it happens, not 90 days later when the forecast is already wrong.
Small, consistent improvements compound dramatically. That’s not a motivational statement. It’s math. A 5% improvement at each of five stages doesn’t add 25% to your revenue. It multiplies. The teams that understand this stop chasing lead volume and start treating their funnel like an engine to tune.
The investment required isn’t massive. Clean your CRM data. Define your stage exits clearly. Build one cohort-based report. Review it weekly with your team. That’s the starting point. Everything else, the coaching, the territory adjustments, the budget reallocation, flows from that visibility.
Structure beats heroics every time. And conversion tracking is the structure.
— Antony
If this article made you realize your team is flying blind on stage-level conversion data, you’re not alone. Most sales organizations have the CRM. They just haven’t connected it to a system that drives decisions.
At Saleslabelconsulting, we work with RevOps leaders, Heads of Sales, and VPs of Sales to build the tracking infrastructure and sales enablement processes that turn conversion data into predictable revenue. We audit what you have, close the gaps, and help your team act on the right numbers every week. If you’re ready to stop guessing and start growing with confidence, explore our sales enablement program built specifically for teams that want predictable, scalable results.
Tracking sales conversion rates reveals exactly where prospects drop off in your funnel, enabling targeted improvements that compound across stages. Without it, revenue problems are invisible until they become missed quarters.
Conversion benchmarks vary significantly by industry, deal size, and lead source. Referral leads, for example, convert at roughly 5 times the rate of social media leads, which is why tracking conversion by source channel is as important as tracking the overall rate.
Define each stage exit as a conversion event, such as MQL to SQL or opportunity to closed-won, then use cohort-based pipeline reports to track actual progression over time. Snapshot reports are useful for weekly reviews but can mask true conversion trends.
Activity tracking measures what reps do, such as calls made or emails sent. Conversion tracking measures what those activities produce at each funnel stage. Teams that only track activity often optimize for effort rather than revenue impact.
Stage-level conversion rates should be reviewed weekly to catch drops early, since root causes of missed quarters often surface 60 to 90 days before revenue is impacted. Cohort-based analysis is best done monthly or quarterly for strategic decisions.
Subscribe to our Insights: Expert productivity tips in your inbox
You'll receive 1-3 emails per month. Your data stays private, always.

CRO & Co-Founder with Sales Label Consulting

Watch our Sales Mates Podcast
July 28, 2026 - 17 min read
Read article Read articleJuly 27, 2026 - 9 min read
Read article Read articleJuly 26, 2026 - 13 min read
Read article Read articleJuly 25, 2026 - 8 min read
Read article Read article