
Explaining Lead Scoring: A RevOps Playbook for B2B Teams
TL;DR:
- Lead scoring ranks prospects by their likelihood to convert using validated signals for better routing. Validating the model against historical data and maintaining separate fit and intent scores are essential for accuracy. Building a system with ongoing audits and clear thresholds ensures scalable, predictable revenue growth.
Lead scoring is a data-driven method that ranks prospects by their likelihood to convert, then routes them to the right follow-up action automatically. Start here: (1) pick one revenue-focused conversion event, either closed-won or booked demo; (2) define your ICP signals (fit) and five high-value behavioral signals (intent); (3) run a quick backtest against three to six months of closed-won data to confirm your signal direction before you assign a single point value.
That backtest is the move most teams skip. Without it, your scoring model is just a committee’s opinion dressed up as data.
Pro Tip: Before your first scoring meeting, pull your last 90 days of closed-won deals and list the five attributes they share. That list is your ICP baseline, and it’s worth more than any scoring template you’ll find online.
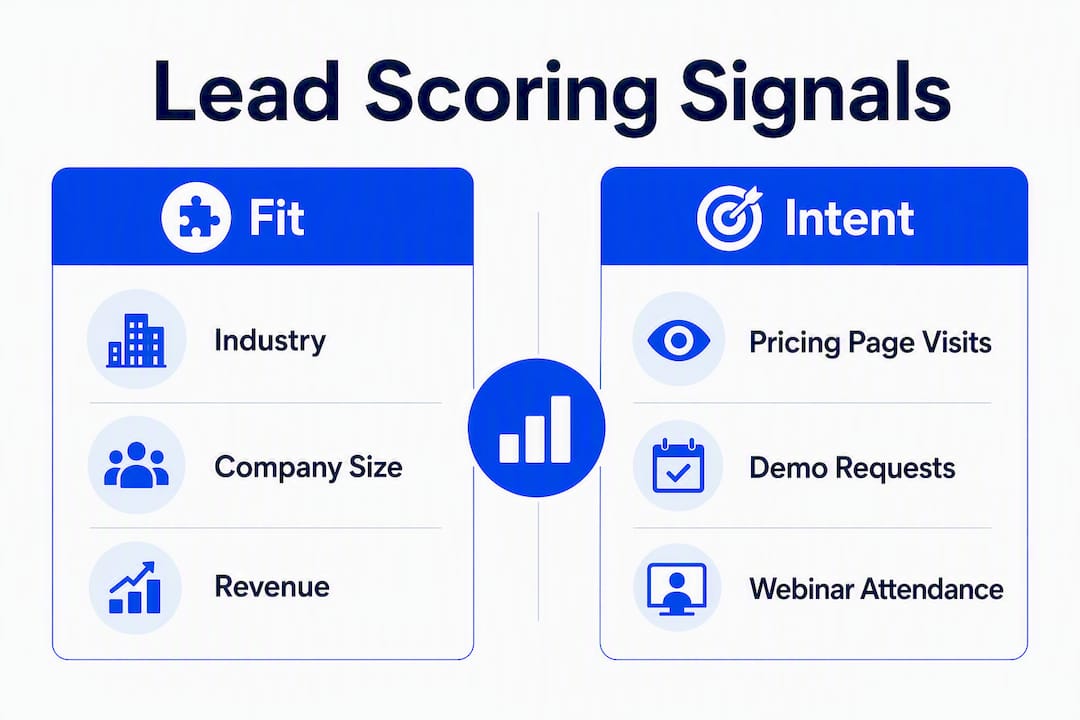
Lead scoring is a methodology that ranks prospects against a scale representing the perceived value each lead represents to your organization. The resulting score determines which leads get prioritized, nurtured, or disqualified. Two dimensions drive every credible model: fit and intent.
Fit covers who the lead is. It draws on firmographic and demographic data: industry, company size, revenue band, geography, job title, and seniority. A VP of Sales at a 200-person SaaS company in your target vertical scores high on fit. A marketing intern at a 10-person agency does not.

Intent covers what the lead is doing. Behavioral signals like pricing-page visits, demo requests, webinar attendance, or repeated email opens indicate purchase readiness. A lead who has visited your pricing page three times in a week is showing intent regardless of their job title.
The signal taxonomy breaks down further into explicit and implicit data. Explicit signals are self-reported: a lead fills out a form and tells you their company size and role. Implicit signals are observed: your marketing automation platform records that the same lead downloaded your ROI calculator and opened four emails in two days. Effective lead scoring models evaluate both dimensions together, because fit without intent is a cold prospect and intent without fit is noise.
The operational output is simple: score maps to tier, tier maps to action. A high-fit/high-intent lead gets routed to a sales rep immediately. A high-fit/low-intent lead enters a nurture track. A low-fit/high-activity lead gets deprioritized or disqualified so your reps don’t waste time chasing someone who will never buy.
The honest case for scoring isn’t that it’s a clever marketing trick. It’s that without it, your reps are prioritizing leads by gut feel, recency, or whoever emailed them last. That’s not a pipeline strategy; it’s a lottery.
Here’s what a working scoring program actually delivers:
That last point is underrated. The alignment benefit alone justifies the investment for most B2B teams. When sales and marketing agree on what a qualified lead looks like, the handoff process gets faster, cleaner, and far less political.
A scoring system is only as good as its operational components. Getting the signal taxonomy right is step one. Keeping it accurate over time is the harder job.
Keep fit and intent as separate scores, not a single blended number. Revenue Operations leaders recommend this because a high reading on one axis should never mask a zero on the other. A lead who is a perfect ICP fit but has shown zero intent needs nurture, not an immediate sales call. A lead who is highly active but completely outside your ICP is noise. Routing logic should use both axes together, not a single opaque composite.
| Signal | Type | Axis | Suggested Weight |
|---|---|---|---|
| Job title matches ICP | Explicit | Fit | High |
| Company size in target range | Explicit | Fit | High |
| Industry matches target vertical | Explicit | Fit | High |
| Geography in served market | Explicit | Fit | Medium |
| Pricing page visit (2+ times) | Implicit | Intent | High |
| Demo request submitted | Implicit | Intent | Very High |
| ROI calculator used | Implicit | Intent | High |
| Webinar attended (relevant topic) | Implicit | Intent | Medium |
| Email opened 3+ times in 7 days | Implicit | Intent | Medium |
| Competitor comparison page visited | Implicit | Intent | High |
| Generic email domain (e.g., Gmail) | Explicit | Fit | Negative |
| Unsubscribed from email | Implicit | Intent | Negative |
| Job title is student/intern | Explicit | Fit | Negative |
Two model types dominate the field, and the right choice depends on your data volume and operational maturity.
You assign point values to signals manually, based on your team’s best understanding of what predicts conversion. A demo request gets +25 points, a pricing page visit gets +15, a generic email domain gets -20. Simple, transparent, and fast to launch.

The upside: any rep or marketer can understand and explain the model. The downside: the weights are opinions until you validate them against real outcomes. Teams that set weights in a planning meeting and never revisit them end up with a model that drifts further from reality every quarter.
Rules-based scoring is a reasonable starting point for lower-volume programs, but it requires regular revalidation to stay predictive.
A machine learning model learns signal weights from your historical conversion data. It finds patterns you wouldn’t have thought to look for, handles edge cases like nonstandard job titles, and scales without manual tuning. For many teams, a hybrid approach works best: deterministic rules handle the clear cases, and an ML layer handles messy edge cases where rules don’t match cleanly.
The trade-off is data requirements. You need enough labeled historical data (leads with known outcomes) for the model to learn meaningful patterns. Without sufficient volume and clean conversion labels, a predictive model will overfit to noise.
When to use each:
This is the part most teams rush. Don’t. The build phase determines whether your model routes leads correctly or just adds another number nobody trusts.
Workflow examples:
Pro Tip: Wire your CRM so the score is visible on the lead record before the rep opens the contact. If reps have to navigate to a separate dashboard to see a score, they won’t use it.
The math is straightforward. Assign point values to signals, sum them up, and apply a 0–100 normalization if needed. Here’s a working example.
| Signal | Points |
|---|---|
| Job title: VP or C-suite | +25 |
| Company size: 100–300 employees | +20 |
| Industry: SaaS or tech | +15 |
| Pricing page visited (2+ times) | +20 |
| Demo request submitted | +30 |
| ROI calculator used | +15 |
| Webinar attended | +10 |
| Generic email domain | -20 |
| Unsubscribed from email | -30 |
| Total (example lead) | +85 |
Formula: Raw Score = Sum of all positive signals + Sum of all negative signals. Normalize to 0–100 by dividing by your maximum possible score.
Worked example 1 (Enterprise B2B): A VP of Engineering at a 300-person SaaS company visits your pricing page twice, attends a webinar, and submits a demo request. Score: +25 (title) + +20 (size) + +15 (industry) + +20 (pricing) + +30 (demo) + +10 (webinar) = 120 raw points, normalized to approximately 85/100. This lead routes to sales immediately.
Worked example 2 (High-volume SMB / e-commerce style): A marketing manager at a 15-person e-commerce company opens three emails, visits one blog post, and has a business email domain. Score: +10 (email opens) + +5 (blog visit) + +5 (business email domain) = 20 raw points, normalized to approximately 20/100. This lead enters a nurture sequence.
For the two-axis approach, calculate fit and intent scores separately, then use a routing matrix: a lead must clear a minimum threshold on both axes to qualify for sales routing. A perfect fit score with zero intent still goes to nurture.
Score decay example: Reduce a lead’s intent score by 10% for every 30 days of inactivity. A lead who scored 60 on intent in January and has done nothing since drops to 54 in February, 49 in March. This prevents stale engagement from clogging your hot-lead queue.
Score thresholds are where the model meets the real world. Set them wrong and you’ll either flood sales with unqualified leads or starve them of pipeline.
Recommended score bands:
SLA example for hot leads:
Special cases to handle:
The lead qualification process should map directly to these score bands so reps know exactly what to do when a lead lands in their queue.
Validation is the step that separates a scoring model from a scoring opinion. A model that has never been checked against closed-won data is merely a guess. Here’s the protocol.
Key metrics to track ongoing:
Audit quarterly. If your hot-band conversion rate drops significantly between audits, your signals have drifted and your weights need updating.
Most scoring programs fail the same way. Here’s the short list of what goes wrong, and what to do instead.
Mistake 1: Set-and-forget scoring. You build the model, launch it, and never touch it again. Markets change, buyer behavior shifts, and your ICP evolves. A model that was accurate 18 months ago may be actively misleading today.
Mistake 2: Scoring only on activity. Email opens and page views are weak signals on their own. A lead who opens every email but never visits a product page or requests a demo is curious, not ready to buy. Weight high-intent actions (demo requests, pricing visits, ROI calculator use) far above passive engagement.
Mistake 3: Skipping negative scores. Without negative scoring, every lead can only go up. Your hot queue fills with students, competitors, and job seekers who clicked a link once.
Mistake 4: Assigning weights by committee opinion. Practitioners consistently warn against setting point values in planning meetings without data-driven validation. Pull your closed-won data first, then assign weights.
Mistake 5: Hiding the score from reps. Scores that live only in your MAP are useless. Write them back to the CRM lead record so reps see the score before they dial.
Governance checklist:
Pro Tip: Run a “scoring town hall” with your sales team once per quarter. Show them the conversion data by score band. When reps see that hot leads actually close at a higher rate, they start trusting the model and using it.
Most B2B teams in the US build scoring on top of their existing CRM and marketing automation stack. Here’s what to expect from the major platforms.
Salesforce offers native lead scoring through its Einstein AI module, which provides predictive scoring based on historical CRM data. The rule-based scoring engine in Salesforce is highly configurable, and the platform’s workflow automation makes threshold-based routing straightforward. Einstein requires sufficient historical data to generate meaningful predictions, and the score writes back natively to the lead and contact record where reps work.
Oracle Eloqua provides a robust scoring framework within its B2B marketing automation suite. Eloqua’s scoring model supports multiple scoring profiles simultaneously, which is useful for teams with distinct product lines or buyer personas. It handles both explicit and implicit signals, and integrates with Salesforce and other CRMs for writeback.
HubSpot includes a built-in manual scoring tool and a predictive lead scoring feature (available on higher tiers) that uses machine learning to identify conversion patterns. It’s a practical starting point for teams that want to get a model running quickly without heavy configuration.
Practical integration tips:
The right tool is the one your reps will actually see. Predictive scores must be written back to the CRM where reps work; otherwise even an accurate model gets ignored.
This section is for the practitioners who are actually building and owning the program. Structure beats heroics here.
Pro Tip: Run your pilot on a single segment or territory before rolling out company-wide. A 60-day pilot with a control group (reps working unscored leads) and a treatment group (reps working scored leads) gives you clean data to justify the full rollout.
Collect rep input formally, not just in Slack. A monthly 15-minute survey asking reps which scored leads converted and which didn’t gives you qualitative signal to complement the quantitative backtest. When reps flag that a specific job title or company type keeps scoring high but never buying, that’s a signal to investigate and potentially add a negative score or remove a weight.
Auditing your sales process alongside your scoring model gives you a complete picture of where pipeline is leaking, not just where leads are being routed.
A working lead scoring program requires a validated conversion event, separate fit and intent axes, threshold-based routing, and a quarterly audit cadence to stay predictive over time.
| Point | Details |
|---|---|
| Separate fit from intent | Score both axes independently; use both in routing logic so neither axis alone drives a handoff. |
| Validate against closed-won data | Replay historical leads through your model and confirm that higher scores produce higher conversion rates. |
| Use negative scoring and decay | Subtract points for poor-fit signals and reduce scores over time to prevent stale leads from inflating your hot queue. |
| Set clear thresholds and SLAs | Define hot/warm/cold bands with specific response time windows and owner responsibilities for each band. |
| Saleslabelconsulting for pilots | Saleslabelconsulting builds and audits scoring models for B2B tech teams, from signal selection through RevOps governance and pilot validation. |
Here’s the honest take: most teams build a model. Very few build a program.
A model is a spreadsheet with weights. A program is a system with an owner, an audit cadence, routing automation, rep training, and a feedback loop that improves the model every quarter. The difference shows up in your pipeline within 90 days.
The teams that get real lift from lead scoring aren’t the ones with the most sophisticated ML. They’re the ones who validated their signals against actual closed-won data, wired the score into the CRM where reps see it, and scheduled a quarterly review before they launched. Structure beats heroics, every time.
One thing worth saying plainly: the threshold is not a permanent decision. Revenue Operations leaders emphasize ongoing testing and collaboration to keep thresholds valid as your market and ICP evolve. Set it, measure it, and adjust it. That’s the program.
If you’re starting from scratch, a 6-month backtest is your first deliverable, not your scoring model. Get the backtest right and the model follows naturally.
Scoring models that sit in a spreadsheet and never get wired into a CRM are the most common waste of RevOps time we see. Saleslabelconsulting works with B2B tech teams to build scoring programs from signal selection through pilot validation and RevOps governance, so you get a model that routes leads correctly from day one, not after six months of firefighting.
The engagement typically covers a scoring audit of your current lead data, a signal selection workshop with sales and marketing, threshold setting with SLA documentation, and CRM writeback configuration. For teams that want to move fast, a sales enablement pilot scoped to a single segment or territory can deliver a validated model in 6–12 weeks. Book a discovery call to scope your pilot and get a clear picture of what your current lead data can actually support.
These are the primary references used in this guide, selected for practitioners who want to validate claims or go deeper on specific topics.
Subscribe to our Insights: Expert productivity tips in your inbox
You'll receive 1-3 emails per month. Your data stays private, always.

CRO & Co-Founder with Sales Label Consulting

Watch our Sales Mates Podcast
September 21, 2026 - 8 min read
Read article Read articleSeptember 20, 2026 - 13 min read
Read article Read articleSeptember 19, 2026 - 13 min read
Read article Read articleSeptember 18, 2026 - 10 min read
Read article Read article