
Creating Effective Sales Reports for Managers
TL;DR:
- Effective sales reports are built around clear objectives, relevant metrics, and insightful analysis that support specific decisions.
- They require well-governed, automated data entry processes and thoughtfully designed formats to drive action rather than just observation.
Most sales reports don’t fail because the data is wrong. They fail because creating effective sales reports requires more than pulling numbers from a CRM and dropping them into a slide deck. The real problem is data overload with no clear direction. Sales managers sit in front of dashboards packed with 20, 30, sometimes 40 metrics, and end up less confident about what to do next, not more. This article cuts through that noise. You’ll get a practical playbook covering objective setting, metric selection, data quality, and report design that actually moves your team forward.
| Point | Details |
|---|---|
| Define objectives first | Know whether your report serves forecasting, coaching, or executive alignment before choosing any metric. |
| Tier your metrics by audience | Executives need 4 to 6 strategic KPIs; managers need 10 to 15 operational metrics to diagnose and coach effectively. |
| Mix leading and lagging indicators | Leading indicators like pipeline velocity give you 60 to 90 days of advance warning before revenue misses hit. |
| Automate data capture | Automating CRM workflows reduces pipeline leakage from 15 to 20 percent down to under 3 percent. |
| Make analysis the centerpiece | The numbers tell you what happened. Your written analysis tells your team why and what to do next. |
Before you touch a single metric or build a single chart, you need to answer one question: what decision does this report need to support? That sounds obvious. Most teams skip it anyway.
A report built for a VP of Sales making resource allocation calls is completely different from one built for a frontline manager coaching rep activity. The importance of sales reports comes down to whether they help the right person make a faster, smarter decision. If your report doesn’t have a named audience and a named decision attached to it, you’re producing output, not intelligence.
Here’s how to get this right before building anything:
Pro Tip: Before designing any report, write a single sentence that says: “This report helps [role] decide [specific decision] every [frequency].” If you can’t write that sentence, you’re not ready to build the report yet.
Real talk: tracking more than 15 metrics causes decision paralysis and dilutes coaching conversations. We’ve seen this play out repeatedly. When everything is measured, nothing gets fixed.
The best approach is a tiered metric structure. Here’s how to think about it:
| Reporting level | Audience | Metric count | Focus |
|---|---|---|---|
| Executive dashboard | VP of Sales, CRO | 4 to 6 | Revenue, forecast accuracy, win rate, churn |
| Operational dashboard | Sales managers | 10 to 15 | Pipeline health, stage conversion, activity, ramp |
| Daily report | Reps, team leads | 5 to 7 | Outreach volume, meetings booked, follow-up rate |
The other critical distinction is leading versus lagging indicators. Lagging metrics like closed revenue and win rate tell you what already happened. Leading indicators like pipeline velocity, lead response time, and stage conversion rates give you a signal of what’s about to happen. Lagging-only dashboards are insufficient because they show you the problem after it’s already too late to course-correct, often 60 to 90 days after the early warning signs appeared.
For enterprise SaaS teams, best-in-class win rates sit at 35 to 40 percent. If your report shows you’re at 22 percent and your pipeline velocity is also dropping, that’s not just a number. That’s a signal that your qualification criteria or your competitive positioning needs immediate attention.
One rule that separates strong reporting from vanity dashboards: every KPI must have an owner, a target, and a defined action if it falls outside acceptable range. If a metric has no owner and no response protocol, remove it. It’s just noise.
Pro Tip: When auditing your current dashboard, apply the “so what” test to every metric. Ask: if this number moved 20 percent in either direction, would anyone know what to do? If the answer is no, that metric doesn’t belong in your report.
You can find a deeper breakdown of which sales KPIs drive accountability at different organizational layers on the Saleslabelconsulting resource hub.
The most well-designed report in the world is useless when the underlying data is wrong. Inconsistent data entry causes the majority of sales reporting errors, and most teams know this but treat it as a back-burner problem until it blows up a forecast.
Here’s a practical process for getting your data house in order:
The shift from spreadsheets to a well-governed CRM isn’t just about speed. It’s about trust. When your team trusts the numbers, they stop second-guessing the report and start acting on it. That shift alone changes meeting culture.

Here’s something most guides on how to write sales reports miss entirely: the format of your report determines whether people act on it or file it away. Numbers without context get ignored. Data storytelling turns a report from a data dump into a management tool.
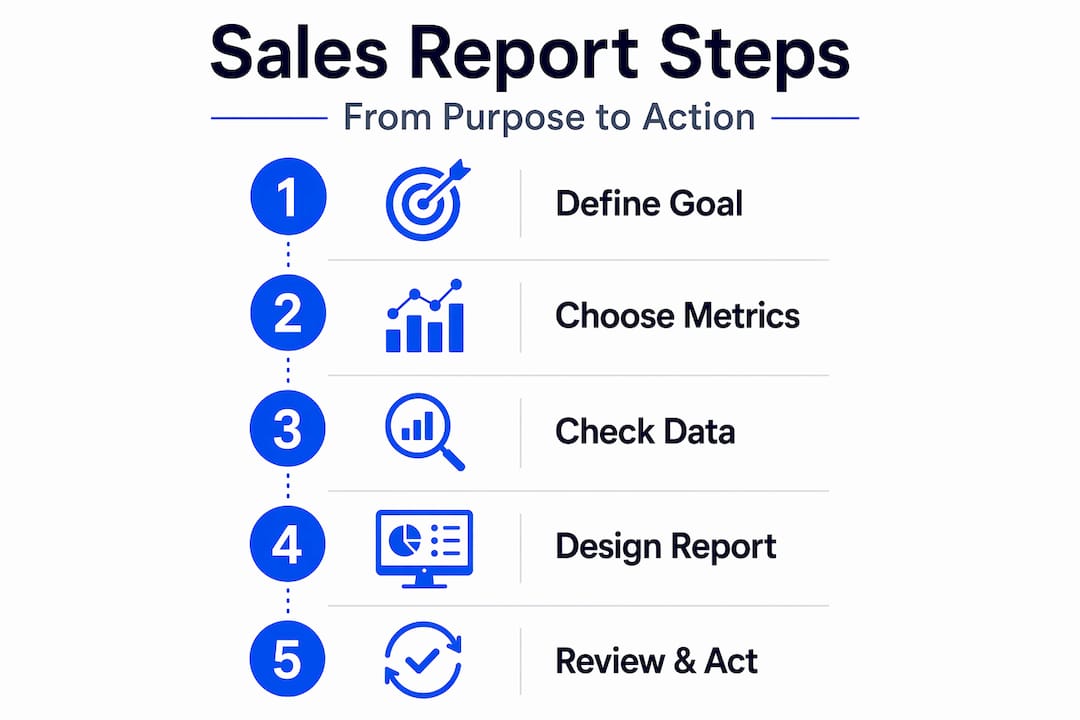
The most important section of any sales report isn’t the charts. It’s the written analysis explaining why the numbers moved and what that means for next week. Without that narrative layer, you’re just delivering a printout.
Some design principles that actually work in practice:
Pro Tip: Before sending any report, read the executive summary out loud. If you can’t say in 30 seconds what the report means and what action it recommends, rewrite it. The test isn’t whether the data is in there. The test is whether someone can make a decision from it in under two minutes.
For teams wanting to go deeper on turning raw data into actual business intelligence, the sales data analysis guide from Saleslabelconsulting walks through the full analytical framework.
You should also regularly review and adjust KPIs as your market, team size, and GTM motion change. A metric that mattered at Series A often becomes noise at Series C. Agile reporting frameworks outlast rigid ones every time.
I’ve worked with dozens of sales teams on reporting design, and the pattern I see most often is this: the team that built the report falls in love with the complexity of it. They’re proud of how much data they can surface. The people who are supposed to use it just want to know what to fix.
In my experience, the most dangerous reports are the ones that feel thorough. A 12-tab dashboard with color-coded RAG statuses and rolling 12-month trend lines does not make anyone a better decision-maker. It makes them feel busy. Structure beats heroics here, just like everywhere else in sales.
What I’ve learned is that the best sales reports I’ve helped build had one thing in common: the sales team was involved in designing them. Not just the ops team, not just leadership. The reps and managers who lived in those numbers every day told us what actually changed their behavior. That’s your design brief.
The evolving role of AI is worth mentioning here. AI integration in sales reporting can genuinely save time and surface predictive patterns, but I’d urge you to start with low-risk, high-volume areas like automated data capture and anomaly detection before trusting AI-generated narratives. Get your data clean first. Then let the machine help. Skipping step one is how teams end up with beautifully formatted reports built on garbage inputs.
The goal isn’t a perfect report. It’s a report that makes your team faster and smarter every week. Ship that, then iterate.
— Antony
If you’ve read this far, you already know the theory. The harder part is applying it to your specific team, your current CRM setup, and the metrics that actually reflect how your business grows.
At Saleslabelconsulting, we work directly with RevOps leaders, Heads of Sales, and VPs of Sales to design reporting systems that create clarity instead of confusion. Our sales enablement framework covers KPI selection, reporting cadence design, CRM data governance, and automation adoption so your team spends less time building reports and more time acting on them. If you want a reporting structure built for predictable revenue, not just prettier dashboards, let’s talk.
An effective sales report ties specific metrics to a named decision-maker and a defined decision cycle, includes written analysis explaining why numbers moved, and is kept short enough to act on within minutes.
Executives need 4 to 6 strategic KPIs, while operational reports for managers work best with 10 to 15 metrics. Daily reports should contain 5 to 7 core metrics focused on leading indicators and consumable in under 2 minutes.
Lagging indicators like closed revenue show past results. Leading indicators like pipeline velocity, lead response time, and stage conversion rates signal performance 60 to 90 days in advance, giving managers time to course-correct.
Report frequency should match the decision cycle: daily for activity metrics, weekly for pipeline health, and monthly or quarterly for trend and strategy reviews. KPIs should also be reviewed periodically to stay relevant as the business evolves.
Inconsistent data entry is the leading cause of sales reporting errors. Clean, standardized CRM data is the foundation that makes every other reporting best practice actually work in practice.
Subscribe to our Insights: Expert productivity tips in your inbox
You'll receive 1-3 emails per month. Your data stays private, always.

CRO & Co-Founder with Sales Label Consulting

Watch our Sales Mates Podcast
Available
June 27, 2026 - 8 min read
Read article Read articleJune 25, 2026 - 7 min read
Read article Read articleFix the System
Not Symptoms