
Win Rate Analysis: Diagnose and Fix in 30 Days for Sales Leaders
Win rate is the share of closed opportunities you actually won, and the quick math is wins divided by total closed opportunities (or opportunities pursued), times 100. If you closed 40 deals and won 12, your win rate is 30%. That number is a starting point, not a verdict. Win rate only becomes useful once you know how you calculated it, what’s hiding inside the average, and how it connects to forecasting.
TL;DR:
- Win rates calculated by deal count are best for evaluating individual sales activity, while dollar-based win rates better forecast revenue and financial performance.
- A sample size of at least 30 to 50 closed opportunities is necessary to derive a stable and reliable win rate metric.
- Divergence between count-based and amount-based win rates indicates deal-size disparities that require segmentation to understand sales performance accurately.
- Internal delays or bottlenecks often cause late-stage deal stalls, which can be diagnosed through segmentation and may be remedied by fixing operational friction.
- Short-term wins from improving CRM data quality and deal qualification processes typically outperform broad team training or incentivization efforts.
Win rate measures conversion efficiency: how good your team is at turning pursued opportunities into closed revenue. Sales teams calculate it two ways, and mixing them up is the fastest way to get a misleading number.
By count (also called deal-based win rate), you divide the number of closed-won deals by the total number of closed opportunities in the period:
By amount (value-based win rate), you swap deal count for dollar value, which matters more if your pipeline has a few massive deals and a long tail of small ones:
In real pipelines, count and amount win rates often diverge sharply, and the gap itself tells you something. In your CRM, an “opportunity” should mean a qualified deal that entered your pipeline stages, not every inbound inquiry. A “win” is closed-won; a “loss” is closed-lost. Anything left open doesn’t belong in either the numerator or denominator. If your pipeline stages and opportunity definitions are inconsistent across reps, fix that before you trust any win rate at all.
The right measurement depends on what decision you’re trying to make.
Rules of thumb: for coaching conversations, lead with count. For board updates and revenue commitments, lead with amount. For product-mix decisions, run both segmented by product line, because a 45% count win rate on your entry product can mask a 15% win rate on your flagship offering.
Pro Tip: Never trust a win rate calculated from a very small number of closed opportunities in the period. A rep who closed 3 of 5 deals didn’t discover a 60% win rate; they got lucky or unlucky, and the number will regress hard next quarter.
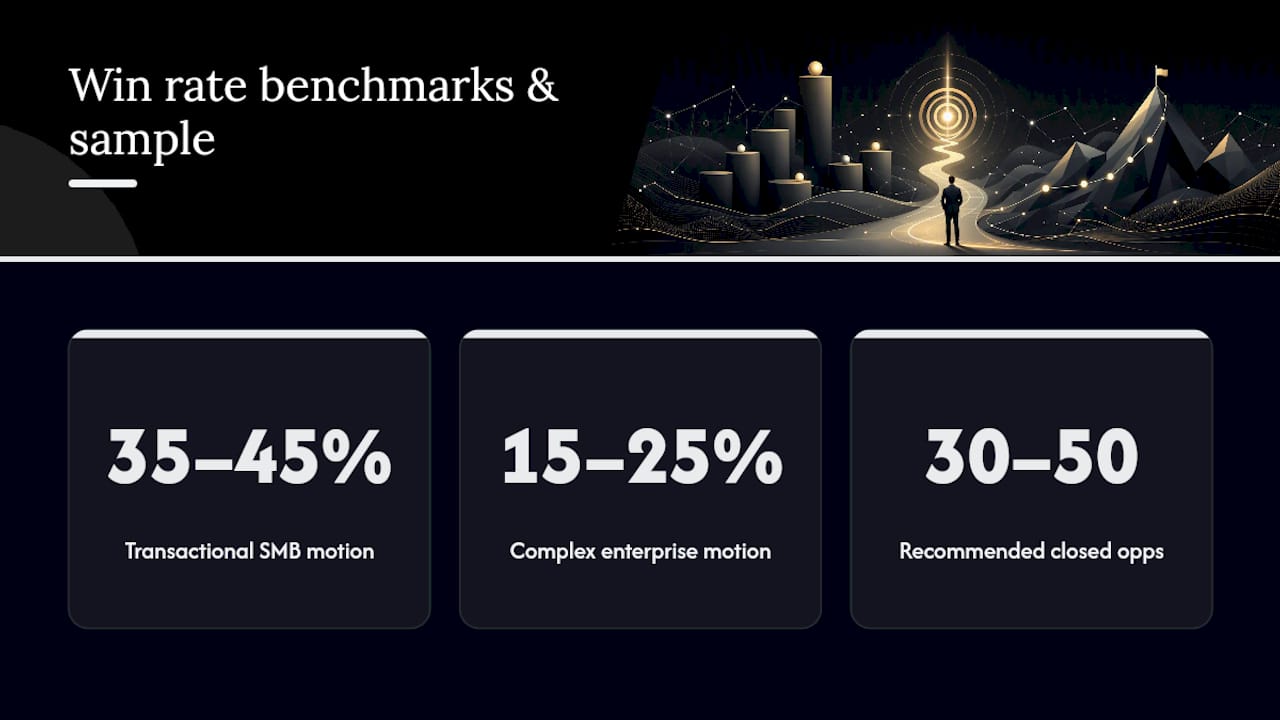
There’s no universal healthy number, because win rate varies enormously by sales motion, deal size, and how strictly you define “opportunity.” A transactional SMB motion with short cycles might run a 35 to 45% win rate; a complex enterprise motion with multiple stakeholders often sits closer to 15 to 25%, simply because more qualified deals get evaluated against more competitors before anyone signs.
Sample size is where most win rate conversations go wrong. A monthly win rate built from eight closed deals swings wildly from one quarter to the next for reasons that have nothing to do with performance. Analysts generally recommend at least 30 to 50 closed opportunities before treating a win rate as a stable signal rather than noise.
A 60% win rate built on small, low-margin deals can generate less revenue than a 25% win rate built on enterprise contracts. Win rate alone can’t tell you which pipeline is healthier.
This is where sales borrows a concept from trading: expectancy, calculated as (win rate × average win value) minus (loss rate × average loss cost, meaning time and resources spent). A high win rate on cheap deals can lose money on effort; a low win rate on large deals can be your most profitable motion. Pairing win rate with payoff ratio instead of reading it alone is the single biggest upgrade you can make to how you evaluate performance.
A blended, company-wide win rate tells you almost nothing about where to intervene. The fix is a repeatable segmentation pass.
Late-stage drops usually point to internal friction rather than competitive losses. Gartner’s research on deal stalls found that internal operational blockers, not external competitors, are frequently the real reason deals stop moving. That reframes the fix: instead of retraining reps on objection handling, you might need to fix approval bottlenecks, pricing friction, or legal review delays.
Pro Tip: If your low win rate clusters in one lead source, don’t blame the reps working those leads. Check lead scoring and opportunity qualification first; a bad source problem looks identical to a bad closer problem until you segment it.
Win rate is the multiplier that turns raw pipeline into a believable revenue number, but only when you apply it correctly.
If your average deal takes five months and your win rate sits at 18%, the coverage math that worked for a competitor with a six-week cycle will leave you badly short at quarter end.
Before you touch commission plans or launch new training, fix the data. A win rate calculated on inconsistent stage definitions or missing close reasons is not a metric worth acting on.
Pro Tip: Change one variable at a time. If you overhaul qualification criteria and pricing in the same month, you’ll never know which change moved the number. Improving top-of-funnel quality through better-targeted demand generation often lifts win rate indirectly, since better-fit leads convert at a higher rate before a single sales tactic changes.
Some consulting firms run this diagnostic with B2B tech clients, using segmentation to separate qualification problems from late-stage process friction before recommending any fix.
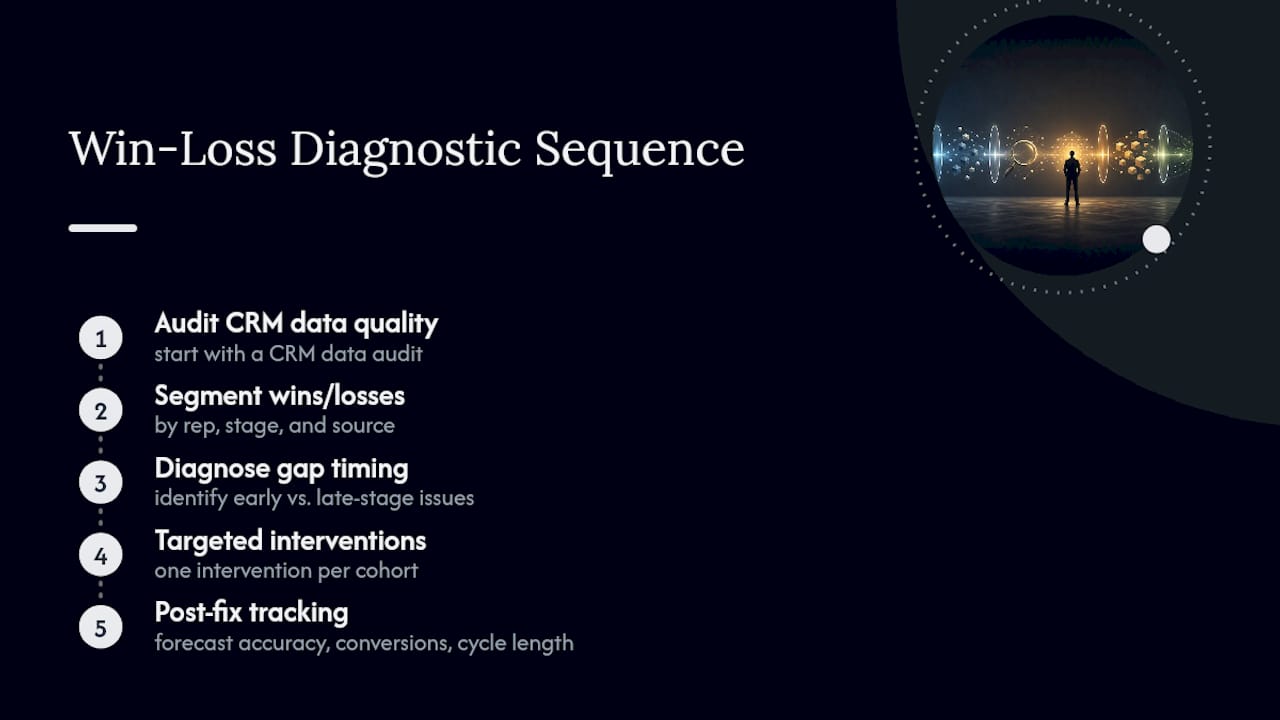
The approach behind these diagnostic engagements follows the same sequence outlined above: audit CRM data quality, segment win rate by rep, stage, and source, diagnose whether the gap is early or late stage, then run one targeted intervention per cohort. Organizations typically track forecast accuracy, stage-to-stage conversion, and average sales cycle length after the diagnostic to confirm the fix actually moved the number, not just the vibe.
Pull your last two quarters of closed opportunities and run the count-versus-amount comparison before you do anything else. If the two numbers diverge by more than a few points, you have a deal-size problem hiding inside a conversion number. Prioritize three things for the quarter: clean stage definitions, a segmentation pass by rep and source, and one measured intervention, tested against a control cohort.
Watch for vanity metrics. A win rate that climbed because your team stopped logging losses isn’t progress; it’s a data integrity problem wearing a good number’s clothes. Pick one lever, measure it properly, and let the result tell you whether to scale it or drop it.
— Antony
Some consulting firms offer a structural approach: they don’t fix win rate in isolation, but trace it back through qualification criteria, deal stages, and team structure until the whole revenue system is aligned, not just one metric.
If your segmentation diagnostic turned up messy CRM data or an unclear stage definition, a Revenue System Diagnostics engagement finds exactly where deals are stalling and why, using the same rep, stage, and source breakdown covered above. Clients typically walk away with a cleaner forecast, a faster read on which deals are actually worth chasing, and a coaching plan built on real segments instead of a hunch. If the gap is on the team-building side rather than process, our Sales Team Setup work rebuilds hiring, onboarding, and role design around the win rate patterns your data already showed you. Book a diagnostic call to get your pipeline segmented and your forecast rebuilt on real numbers.
It depends entirely on your sales motion and average deal size.
Divide the number of won deals by the total number of closed opportunities (won plus lost), then multiply by 100. For a revenue-focused view, run the same formula using dollar value instead of deal count.
A high win rate on small, low-margin deals can still produce weaker expectancy than a lower win rate on larger contracts.
The more useful question is whether your win rate is stable, properly segmented by rep and stage, and paired with average deal value before you call it good or bad.
Saleslabelconsulting runs structured Revenue System Diagnostics that segment win rate by rep, stage, and lead source to find exactly where deals are stalling. Pricing for these engagements is available directly on the services page rather than published as a flat rate.
Subscribe to our Insights: Expert productivity tips in your inbox
You'll receive 1-3 emails per month. Your data stays private, always.

CRO & Co-Founder with Sales Label Consulting

Watch our Sales Mates Podcast
September 20, 2026 - 13 min read
Read article Read articleSeptember 19, 2026 - 13 min read
Read article Read articleSeptember 18, 2026 - 10 min read
Read article Read articleSeptember 17, 2026 - 16 min read
Read article Read article