
Stop Territory Planning Mistakes: 30/90/365 Fix for Sales & RevOps
Most territory plans fail for one boring reason: the math is wrong before the map is even drawn. Reps get assigned by zip code instead of account potential, workloads go unbalanced, and nobody checks the CRM data underneath it all. The fix is not complicated. Score accounts by real potential, build workload models that account for effort, validate everything with the field, and revisit the plan on a set cadence. Everything below breaks down exactly where plans go wrong and how to fix each one.
TL;DR:
- Assigning territories solely based on geographic boundaries often leads to unbalanced workloads and underserved high-value accounts due to flawed potential analysis.
- Building effort-weighted workload models and revisiting them regularly helps ensure territories are realistic and evenly matched to reps’ capacity, boosting revenue growth.
- Poor CRM data quality causes inaccuracies in account scoring and workload calculations, making thorough audits and automated validation essential before planning.
- Integrating territory potential into quota setting reduces disputes and aligns on-target earnings with achievable goals, preventing early rep disengagement.
- Incorporating field input and market intelligence into the planning process uncovers blind spots and adapts plans to changing conditions, avoiding static maps that quickly become outdated.
Drawing lines on a map by zip code or state border feels fast and fair. It rarely is. Practitioners call this the “geographic trap,” and it’s widely considered the most common failure mode in B2B territory design because geography has nothing to do with where the revenue actually sits.
Here’s what happens when you assign by boundary lines instead of potential: one rep inherits a sprawling rural territory with three viable accounts, while a colleague two states over gets a metro area stuffed with fifty high-fit prospects they can’t possibly work well. Pockets of high-value accounts sit underserved because nobody flagged them, and reps with dense, complex territories burn out trying to cover ground that was never sized for one person.
The fix is an outside-in analysis before you draw a single line. Score every account on total addressable spend, firmographic fit (employee count, tech stack, industry vertical), intent signals, and existing customer concentration. Intent data alone can surface the 20 to 30 active buying accounts a rep should prioritize in their first 90 days, which matters enormously when you’re trying to shorten ramp time on a new patch.
Before you finalize any territory boundary, run it through a short checklist:
Pro Tip: Run the account-scoring pass first, then let geography follow the accounts. Drawing the map before you know where the potential sits is the exact sequence that creates the geographic trap in the first place.
If your current territories were built purely on geography, an account-based approach to sales development gives you a framework for rebuilding coverage around fit instead of proximity.
Two reps can have the “same size” territory and still be doing wildly different jobs. One is knocking out fifteen easy renewals a month. The other is chasing forty accounts across three time zones with complex, multi-stakeholder deals. Raw account counts hide this completely.
Workload has four real components: expected number of touches per account, travel time between accounts, deal complexity (multi-threaded enterprise deals eat far more hours than single-decision-maker SMB deals), and account maintenance burden for existing customers. A territory with 60 simple transactional accounts might demand less total effort than one with 25 accounts that each require a buying committee.
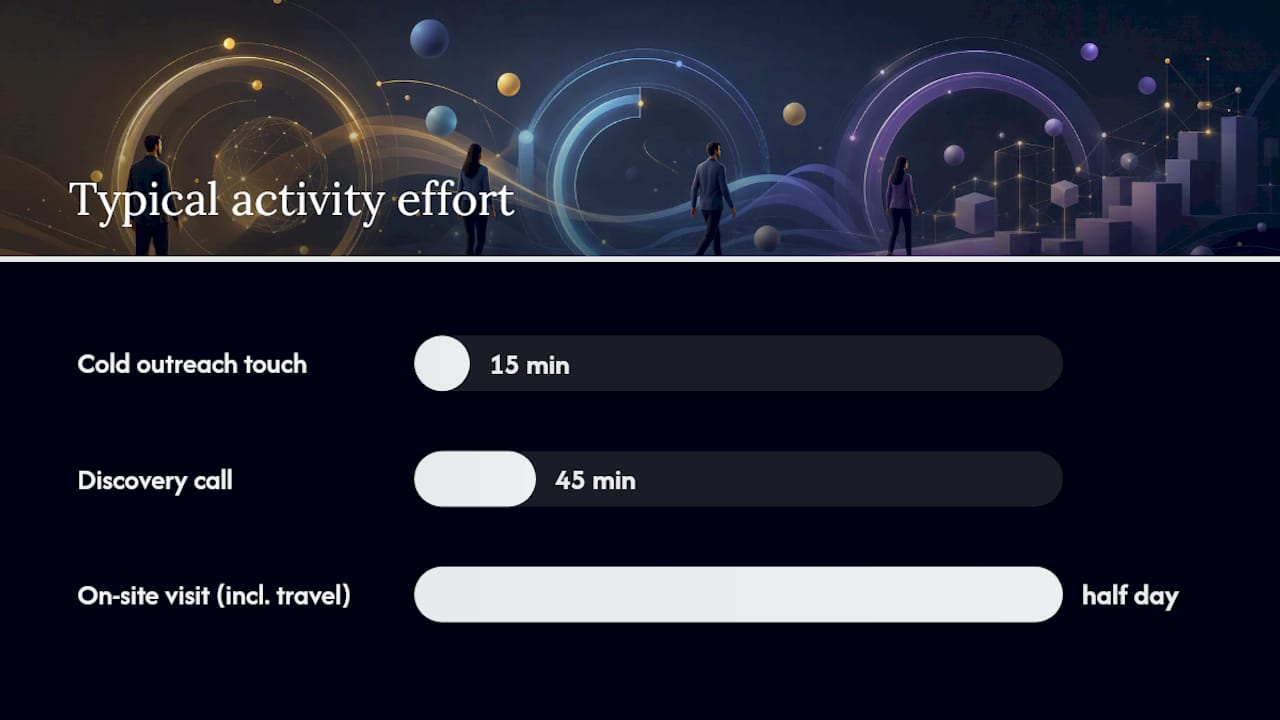
Build an effort-weighted workload model instead of a headcount model. Assign a rough hour value to each activity type. Cold outreach touch, 15 minutes. Discovery call, 45 minutes. On-site visit including travel, half a day. Multiply by expected frequency across the account base, and you get a real workload score per territory instead of a guess.
A practical target: keep each territory’s total weighted workload within a narrow band close to the team average, avoiding significant imbalances. Anything wider than that and you’re setting some reps up to fail and others up to coast.
Balanced territory design that equalizes weighted opportunity, not raw account counts, has been linked to revenue increases of 2 to 7 percent without adding a single new headcount. That’s not a rounding error. That’s a full quarter of growth sitting inside better math.
You can build the most sophisticated territory model in the world and it will still fail if the CRM data underneath it is wrong. Duplicate accounts, stale contact records, and mismatched firmographic enrichments distort everything downstream, from account scoring to workload calculations.
Industry research puts real numbers behind this: roughly 64% of organizations name data quality as their top challenge in territory analysis, and Gartner has estimated the cost of poor data quality to organizations at an average of $12.9 million annually. That’s not an abstract IT problem. That’s misrouted accounts, wrong quota assumptions, and reps working off information that was outdated six months before the plan even launched.
Run these steps before you touch the territory map:
Pro Tip: Treat the data audit as a gate, not a formality. If your CRM hygiene isn’t clean, delay the territory redesign by two weeks rather than build a plan on bad inputs you’ll have to unwind later.
Ongoing controls matter as much as the initial cleanup. Sync your CRM to whatever planning tool you use so account moves and enrichment updates flow automatically, and schedule recurring audits rather than waiting for the plan to visibly break.
Here’s a sequence problem that causes more sales team turnover than almost anything else: building the territory map first, then bolting quotas on afterward without checking whether the numbers are even achievable.
The correct order runs the other way. Assess territory potential first, model quota off that potential, and validate on-target earnings before anything gets deployed to the field. Skip that sequence and you get quota disputes in week one, reps quietly disengaging because the number was never realistic, and comp plans that pay wildly unevenly for the same level of effort.
Integrating territory potential with quota-setting preserves quota credibility and materially reduces disputes once the plan goes live. It also protects your on-target earnings promise, which is the thing reps actually care about when they decide whether to trust the comp plan or start job hunting.
A simple modeling approach:
Build in a mid-year adjustment window too. Market conditions shift, and a quota that made sense in January can be unfair by June. Reviewing quota against real territory performance and adjusting where the math is clearly broken is far cheaper than losing a rep over it. For the mechanics of setting and validating quota numbers, this breakdown of quota management walks through the process in more detail.
Territory plans built entirely from a dashboard, with zero input from the reps who’ll actually work the accounts, tend to miss things that only show up on the ground. A key account might be in the middle of a leadership transition. A “high potential” account on paper might have quietly churned relationship equity with your last rep. Data models don’t catch that. Reps do.
Excluding the field creates blind spots and, just as damaging, breeds resentment. A rep who wakes up to a reassigned territory with no warning and no chance to weigh in is a rep who starts updating their resume. Practitioner guidance consistently points to structured field feedback as essential for surfacing local market intelligence that quantitative models simply can’t see.
Build these mechanisms into the process:
Pro Tip: Pilot territory changes with a small group first and gather their feedback before rolling changes out company-wide. A two-week pilot surfaces problems a spreadsheet never will.
Spreadsheets work fine for ten territories. They fall apart at fifty, and they actively cost you deals at a hundred or more.
The problems compound quietly. Version control breaks down when three people are editing separate copies. Manual formulas introduce errors that nobody catches until a rep’s quota is visibly wrong. Scenario modeling, running a “what if we split this territory in two” test, takes hours instead of minutes because every recalculation is manual. Many organizations still rely on spreadsheets for territory work well past the point where the format can support them.
Watch for these signs that you’ve outgrown the spreadsheet:
If any of that sounds familiar, it’s time to evaluate a dedicated tool. Look for CRM integration (so account data stays live), geospatial layering (to visualize coverage gaps, not just list them), scenario modeling (fast what-if testing), and direct quota linkage so territory and comp stay connected instead of drifting apart in separate systems.
If you’re not ready to migrate yet, at minimum lock your spreadsheet with version control, restrict edit access to one owner, and rebuild the account-scoring formulas from scratch rather than inheriting last year’s broken logic.
A territory plan built in January is already stale by August. Markets shift, reps leave, accounts get acquired, and a plan that was fair on day one can be badly lopsided six months later if nobody’s watching.
The cadence that works for most teams is layered: a full annual planning cycle, quarterly health checks in between, and event-triggered reviews whenever something material changes. Recommended practice is a minimum of annual reviews with quarterly checks layered on top, not an annual review alone.
Specific triggers that should force an off-cycle review regardless of where you are in the calendar:
Track a small set of KPIs continuously rather than waiting for the quarterly check to surface problems:
When a review flags a problem, resist the urge to blow up the whole map. Save full reorganizations for when the underlying business has genuinely changed shape, like a merger or a new product line that redefines your entire ideal customer profile.
Running a territory redesign without a structured pre-rollout checklist is how good intentions turn into another failed plan. Before any new map goes live, work through five gates in order: audit the data, model the workload, run it past the field, validate the quota, then pilot before full rollout.
A 90-day pilot beats a full rollout every time you’re testing a materially new approach. Start with a subset of territories, roughly 10 to 20% of the total, and focus the pilot on intent-led account activation so reps are working the accounts most likely to convert first. Track attainment variance and coverage metrics weekly, not just at the 90-day mark, so you catch problems while they’re still cheap to fix.
Build these into a reusable template rather than reinventing it every planning cycle:
Pro Tip: Keep the pilot small enough that a mistake is cheap to reverse.
If you fix nothing else this week, fix the account-scoring model. Everything downstream, workload, quota, coverage, depends on knowing where the real potential sits before you touch a boundary line.
Bring RevOps, sales leadership, and finance into the room before quota gets finalized. You’ll need clean CRM exports, a workload model, and a rep feedback log as your core artifacts, not a single spreadsheet everyone’s guessing at.
A territory that looked strong last year can quietly turn weak if a competitor moved in and nobody adjusted the plan. Territory design too often gets built purely on your own account data, ignoring how much of that potential is contested.
Two territories can show identical revenue potential on paper and be completely different opportunities in practice, one wide open, one where a competitor has locked in three of your top five target accounts. Layer competitive intelligence into your scoring model: which accounts have an incumbent vendor, which markets show rising competitive activity, and where a competitor’s recent funding or expansion might shift buyer attention.
Market potential matters just as much as competitive pressure. A territory’s total addressable spend might be growing fast in one region and flat in another, even if both territories look similar in account count today. Reps working a flat or shrinking market need a different quota expectation, and possibly a different account mix, than reps in a market that’s expanding.
Build a lightweight competitive layer into your account tiers: flag accounts with known incumbent vendors, track competitor win/loss patterns by region, and revisit that layer whenever the quarterly health check runs. Skipping this step means you’re planning territory potential in a vacuum, and vacuums rarely match reality once reps start knocking on doors.
Territory maps and go-to-market segmentation frequently get built by two different teams that never talk to each other. Marketing defines buyer personas and ideal customer segments. Sales leadership draws territory lines. When those two efforts don’t connect, reps end up covering accounts that don’t match their skill set or your positioning.
A rep who excels at complex, multi-stakeholder enterprise sales gets handed a territory heavy on transactional SMB accounts, and a rep built for fast-cycle SMB deals inherits a patch full of six-month enterprise sales cycles. Neither plays to strength, and both quotas suffer for it.
Fix this by segmenting territories around buyer persona and deal complexity, not just geography and account count. If your ideal customer profile includes both enterprise IT buyers and mid-market operations leaders, those two segments likely need different sales motions, different content, and arguably different reps. Territory design should mirror that split rather than blending both into one undifferentiated patch.
Cross-check your territory assignments against your segmentation model at least once a year: does each territory’s account mix match the persona and deal-type strengths of the rep assigned to it? Where it doesn’t, that’s a signal worth acting on before the mismatch shows up in a missed quota.
Bigger territories aren’t automatically better, even when the total potential looks impressive on a spreadsheet. A rep covering too many accounts, or accounts spread across too wide a geography, ends up thinning out attention across the board. Response times slip. Renewal conversations get rushed. Upsell opportunities get missed because nobody had the bandwidth to notice them.
Customer relationship quality is a direct function of how much real attention each account gets, and territory size sets the ceiling on that attention. An account that needs quarterly business reviews and proactive check-ins gets neither if the assigned rep is juggling 80 other relationships.
This ties directly back to workload modeling, but it deserves its own gut check: for your highest-tier accounts, what’s the realistic touch frequency a rep can sustain given everything else on their plate? If the honest answer is “less than what that account actually needs to stay healthy,” the territory is oversized for its service requirements, regardless of what the total addressable spend number suggests.
Segment territory size expectations by account tier rather than applying one blanket account-count target across the board. A territory of 15 enterprise accounts requiring high-touch service is a very different job than a territory of 60 self-serve SMB accounts, even if the total revenue potential is similar on paper.
Demand doesn’t move at a flat, constant pace across the calendar year, and a lot of territory plans quietly assume it does. A territory built around a market that spikes hard in Q4 and goes quiet in Q1 needs a workload model that reflects that swing, not a static effort target applied evenly across twelve months.
Retail-adjacent B2B sectors, education technology, and anything tied to fiscal-year budget cycles all show pronounced seasonal patterns. A rep covering education accounts might need double the touch frequency in the spring budget-planning window and far less in summer. Applying the same weighted workload score year round in that territory sets up an inaccurate picture of whether the rep is actually overloaded or underutilized.
Build seasonality into your workload model as a variable, not an afterthought. Look at historical close-rate and activity patterns by month for each territory’s dominant industry mix, and adjust the effort-weighted score to reflect peak versus trough periods. This also affects quota pacing: a flat, evenly distributed quota target across a seasonal territory sets reps up to look like they’re behind in slow months and coasting in peak ones, when in reality they’re following the market’s own rhythm.
Sales leaders tend to treat territory planning as a mapping exercise. Draw the right lines, get the right software, and the problem is solved. That framing is backwards, and it’s why so many redesigns fail to move the needle even after months of work.
The map is the last step, not the first. Every mistake covered here, geography over potential, unbalanced workload, disconnected quota, excluded field input, traces back to the same root issue: teams size their territories to convenience instead of evidence. Convenience says “split it by state.” Evidence says “score every account, weight the effort, and check it against what the rep can realistically cover.” Those produce very different maps.
What surprises most leaders once they run the account-scoring exercise honestly is how unevenly potential is actually distributed. It’s rarely a clean, even split. A handful of territories usually carry a disproportionate share of the addressable revenue, and pretending otherwise, just to keep the org chart tidy, is how quota disputes and quiet attrition start six months later.
If there’s one habit worth building into your planning calendar, it’s treating the quarterly health check as seriously as the annual plan. Annual planning gets the attention and the budget. Quarterly checks are where the actual course correction happens, and skipping them is how a perfectly reasonable January plan turns into a broken August one.
— Antony
You don’t have to run this rebuild solo. Consulting firms can work directly with B2B tech sales leaders to address these problems, using real revenue-system rebuilds instead of theory.

If the geographic trap or a disconnected quota model sounds familiar, a Revenue System Diagnostics engagement is the fastest way to see where your current territory math is breaking down before you invest in a full redesign. From there, engagements often follow a process: audit first, pilot changes on a subset of territories, then provide a validated plan the team can run independently. For teams whose workflow issues run deeper than territory lines, a full sales workflow audit surfaces the process gaps that territory redesign alone won’t fix. Booking a diagnostic conversation and bringing a current territory map can be helpful to identify mistakes affecting revenue.
The geographic trap, assigning territories by zip code or state line instead of account potential, is widely considered the most common failure, since it routinely leaves high-value accounts underserved while overloading other reps.
Run a full territory review annually, paired with quarterly health checks and immediate reviews whenever a major trigger hits, such as rep attrition, an account acquisition, or a new product launch.
Yes. Saleslabelconsulting’s Revenue System Diagnostics engagement audits existing territory and quota structures and identifies the specific mistakes dragging down coverage and quota attainment.
Yes. Data quality issues are cited as the top challenge by roughly 64% of organizations working on territory analysis, and bad data distorts every downstream decision from account scoring to quota modeling.
Subscribe to our Insights: Expert productivity tips in your inbox
You'll receive 1-3 emails per month. Your data stays private, always.

CRO & Co-Founder with Sales Label Consulting

Watch our Sales Mates Podcast
September 16, 2026 - 14 min read
Read article Read articleSeptember 15, 2026 - 10 min read
Read article Read articleSeptember 14, 2026 - 10 min read
Read article Read articleSeptember 13, 2026 - 8 min read
Read article Read article