
RevOps: Evidence-First Lead Response Time Benchmarks for a 7-Day SLA
Aim for sub-5 minutes on demo and pricing leads, under 1 hour on inbound forms. That’s the target, full stop. The evidence backing it comes from three sources: the 2007 Lead Response Management study, HBR’s 2011 audit involving 2,241 companies, and modern speed-to-lead tracking. The single highest-leverage move to improve lead response is building SLAs and routing rules that support fast responses rather than relying on reps noticing leads quickly.
TL;DR:
- Responding within 5 minutes greatly increases contact and qualification rates, but only about 14.6% of leads typically receive such prompt replies.
- Most teams respond to leads in the 30-minute to 1-hour range, which is effective but leaves significant qualification opportunities on the table.
- Setting industry-specific SLAs, such as under 5 minutes for demo requests and under 15 minutes for pricing inquiries, improves qualification odds.
- Fixing routing issues and implementing automation can significantly improve response times, often yielding faster results than hiring additional reps.
- Accurate measurement requires precise definitions of response and reconciliation of timestamps across systems to avoid misleading metrics.
Here’s the real talk: most sales teams have no idea where they actually land on this scale until someone runs the numbers. Once you do, the tiers are stark.
We think in six buckets, and each one carries a different commercial reality.
| Response Tier | Time Window | What It Typically Means |
|---|---|---|
| Best in class | Under 5 minutes | Peak contact and qualification odds |
| Strong | 5 to 30 minutes | High intent still captured |
| Average | 30 minutes to 1 hour | Common among disciplined teams |
| Below average | 1 to 4 hours | Buyer attention has likely shifted |
| Poor | 4 to 24 hours | Qualification odds drop sharply |
| Broken | Over 24 hours / no response | Lead is effectively dead |
A 2026 panel study of 28,400 leads across 184 B2B accounts found the median first-touch time was 1 hour 42 minutes, with only 14.6% of leads getting a sub-5-minute response. Most teams are living in the “average” to “below average” range and calling it fine. It isn’t fine. It’s just common.
You’ve probably heard the “5-minute rule” quoted like gospel. It’s real, but it comes from a specific place, and knowing that place matters if you’re going to defend your SLA targets to a skeptical CFO.
The 2007 Lead Response Management study, led by Dr. James Oldroyd in partnership with InsideSales.com, tracked roughly 15,000 leads and more than 100,000 call attempts across six companies over three years. The finding that gets quoted everywhere: calling a lead at 5 minutes instead of 30 minutes was associated with about 100 times higher odds of making contact and 21 times higher odds of qualifying that lead. Those are odds ratios from a specific sample of companies, not a universal law of physics.
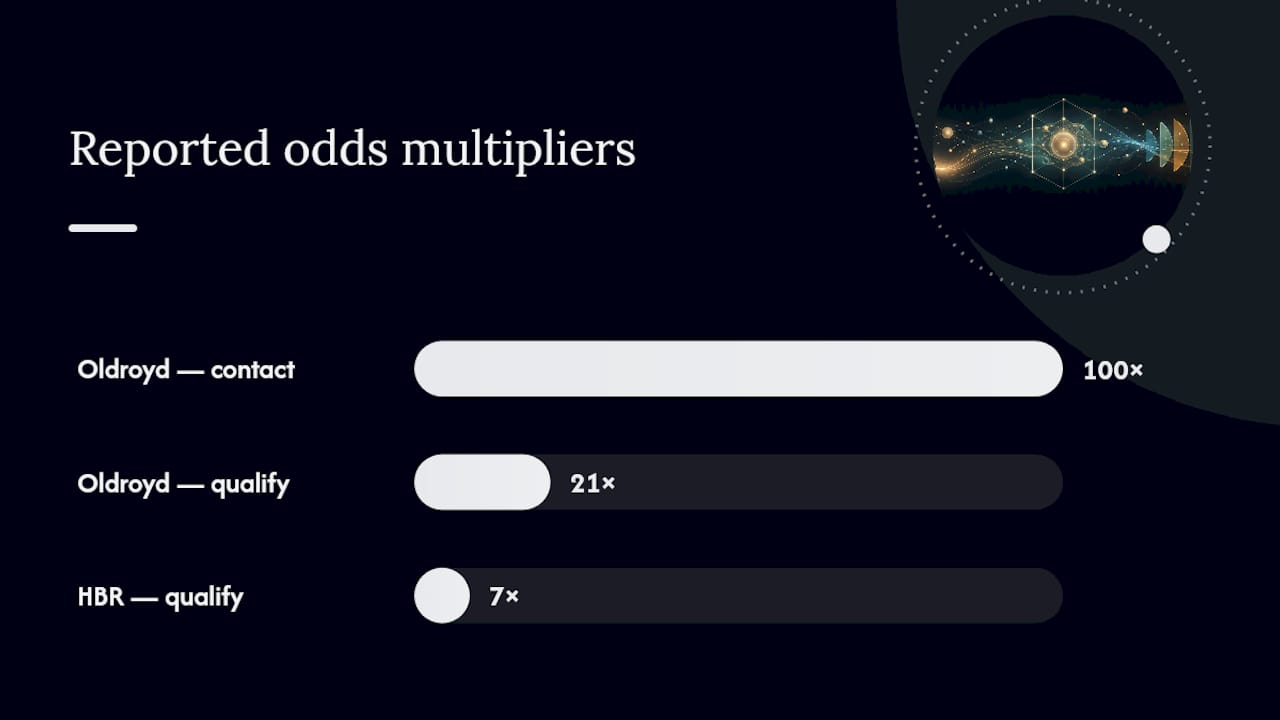
Four years later, the 2011 Harvard Business Review audit took a wider lens: 2,241 companies, measuring how fast each one actually followed up on a submitted lead. The average response time was 42 hours. Companies that responded within one hour were nearly seven times more likely to qualify the lead than those that waited even one hour longer.
A few things to keep in your back pocket before you cite either study in a board meeting:
The observed multipliers indicate substantially higher qualification odds when responding faster: an approximately 21-fold increase when calling at 5 minutes vs. 30 minutes, and about 7-fold higher odds when responding within an hour versus later, according to the HBR audit. What matters is translating that into numbers your CFO recognizes.
It moves the qualification odds for those 100 leads up by a factor tied to HBR’s near-7x effect. Even a conservative read of that lift, applied to your own qualify-to-close rate, usually produces a meaningfully larger pipeline than any other single process change you could make this quarter.
Here’s the nuance that gets lost: an odds ratio isn’t the same as an absolute conversion rate. It means the relative odds jump, and you still have to run that through your own funnel math to get a believable forecast. The 2026 panel data is useful here because it shows bucketed conversion rates directly, not just relative odds, so you can sanity check any multiplier against real observed outcomes instead of extrapolating blind.
Use both numbers. The odds ratio tells you where to invest. The absolute rate tells you what to actually put in next quarter’s forecast.
Not every lead deserves the same SLA. Treating a chat message and a white paper download identically is how teams burn out their SDRs chasing low-intent leads at the same speed as high-intent ones.
By lead source, we’d set targets like this:
By industry, the medians and the ceiling both shift. SaaS companies tend to run the tightest response times because so much of the buyer journey happens self-serve before a lead ever hits a rep’s queue, and best-in-class SaaS teams push toward that sub-5-minute demo target aggressively. Financial services and other regulated sectors typically run slower medians, often in the multi-hour range, partly because compliance review adds friction to outbound contact. Professional services firms land somewhere in the middle, usually in the 30-minute to 2-hour band, since deal sizes are large enough to justify a human touch but sales cycles are long enough that an extra hour rarely kills the deal. Local services businesses (contractors, agencies, single-location providers) show the widest variance. Some are excellent because one person owns the phone; others are broken because nobody owns it at all.
The smartest move is segmenting your own historical data by lead type and comparing your median response time against your close rate for each segment. Industry benchmarks are a starting point, not a finish line, and your own numbers will tell you exactly where the leak is.
Benchmarks are useless without a system that enforces them. Here’s a practical rollout sequence we’d run in the first one to four weeks of a sales audit.
Structure beats heroics here. You don’t need a hero rep who’s fast when they happen to be at their desk. You need a system that’s fast regardless of who’s on shift.
Pro Tip: When a lead has already gone cold past your SLA window, the instinct is to call more. Resist it. A lead that sat unanswered for six hours usually responds better to a channel switch, an email or a text, than to a fourth unanswered ring on the same phone number. Dialing harder on a stale lead just burns rep time; switching the channel actually gets a reply.

If your team structure is part of the problem, it’s worth revisiting how you’ve built your sales team before you add more SLA rules on top of a broken rotation.
The metric only means something if everyone agrees what “response” counts as. Define it precisely: first meaningful contact means a human reply, a scheduled call, or a chat response that engages the lead’s actual question, not an autoresponder or a generic “thanks for reaching out” email.
Timestamps are where most measurement breaks down. The lead form fires a timestamp when submitted. Your CRM logs a different timestamp when the record gets created, which can lag the form by minutes if there’s a sync delay. Chat platforms log their own clock separately. If you’re pulling from three systems that don’t agree on “time zero,” your reported median response time is fiction. Reconcile these sources before you trust a single number in a board deck, and understanding the difference between a raw lead and a qualified prospect helps clarify exactly which timestamp should start the clock.
A simple weekly reporting template covers the essentials:
| Metric | What It Tells You |
|---|---|
| Median response time | Typical experience, less skewed by outliers than the average |
| % responded under 5 minutes | Your best-in-class hit rate |
| % responded under 1 hour | Your broad SLA compliance |
| % never responded | The size of your leak |
| Handoff latency (marketing to sales) | Where delay originates in the process |
Report median, not just average. One 3-day-old lead that finally got a reply can drag your average up and hide the fact that most leads are handled fine. Review this weekly during rollout, then move to monthly once your numbers stabilize.
Most slow response times trace back to a handful of repeat offenders. Fix these first before you touch anything else.
Run these as three quick experiments: a one-week chat triage pilot, a 7-day rotating demo-duty rota, and a shared SLA dashboard reviewed at daily standup. Measure success by the same four numbers from your reporting template. If the sub-5-minute rate and 1-hour hit rate move within two weeks, you’ve found your leak.
We use these benchmark buckets as the starting point in nearly every sales audit we run, because they give a client’s leadership team an immediate, defensible frame for “are we actually fast or just busy.” The SLA ladder comes next: once a team sees their real median against the tiers, the routing conversation gets a lot easier to have.
In our Sombra engagement, the first change clients typically make isn’t hiring more reps. It’s fixing routing and ownership so the leads they already have get touched faster. That’s almost always cheaper and faster to implement than headcount, and it’s usually where the biggest early win sits.
If you want a structured look at where your own response times are leaking pipeline, a sales audit is the fastest way to find out, and our sales enablement programs pick up right where the audit leaves off. Teams looking at their routing infrastructure specifically might also find CRM automation options worth a look for the technical build.
— Antony
Subscribe to our Insights: Expert productivity tips in your inbox
You'll receive 1-3 emails per month. Your data stays private, always.

CRO & Co-Founder with Sales Label Consulting

Watch our Sales Mates Podcast
September 3, 2026 - 9 min read
Read article Read articleSeptember 2, 2026 - 11 min read
Read article Read articleSeptember 1, 2026 - 8 min read
Read article Read articleAugust 31, 2026 - 10 min read
Read article Read article