
How to set sales KPIs: A guide for tech sales leaders
TL;DR:
- Most sales leaders struggle with tracking too many KPIs rather than none at all, which hampers focus. Prioritizing 5 to 7 aligned metrics across activity, outcomes, and efficiency improves predictability and coaching. Regular, disciplined reviews and clear ownership are essential for building a high-performing sales KPI framework.
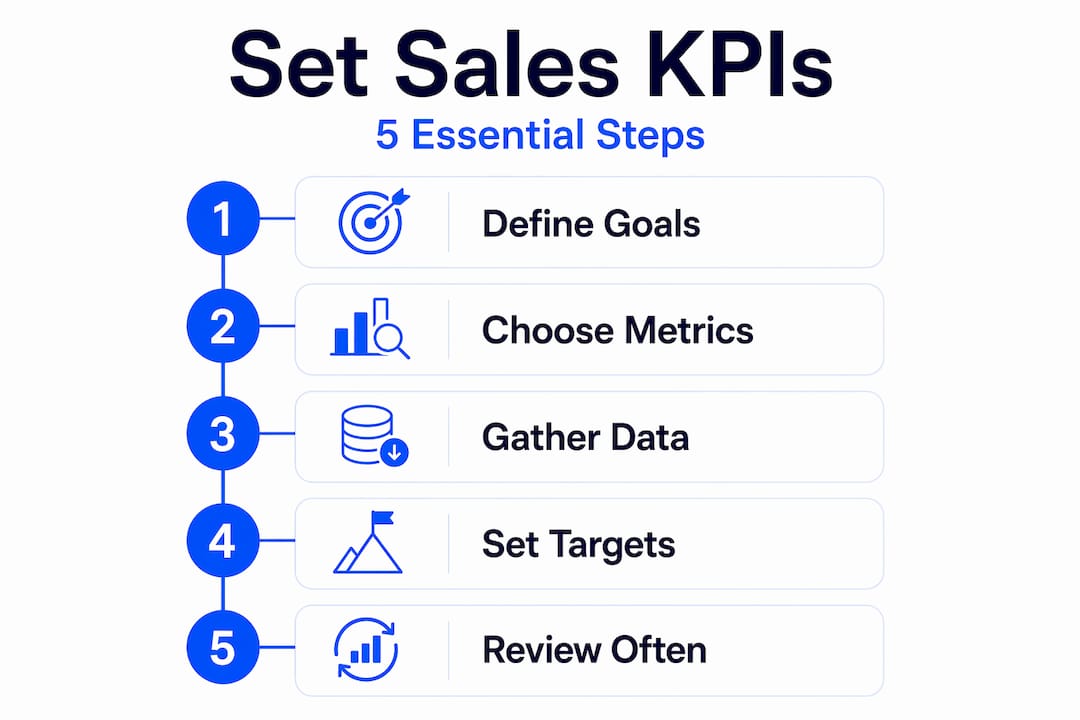
Most sales leaders we talk to aren’t struggling because they track zero KPIs. They’re struggling because they track too many. Knowing how to set sales KPIs that actually move the needle is one of the highest-leverage decisions you can make as a Head of Sales or VP of Sales in a European tech company. The difference between a team that hits quota predictably and one that scrambles every quarter often comes down to whether they’re chasing five focused metrics or drowning in a dashboard of thirty. This guide cuts through the noise, walks you through the full process, and gives you a practical framework to get it right.
| Point | Details |
|---|---|
| Focus your KPIs | Track 5–7 core KPIs that directly align with your sales goals to avoid confusion and improve focus. |
| Use reliable data | Collect 6–12 months of clean sales data to accurately establish performance baselines before setting targets. |
| Benchmark properly | Calculate pipeline coverage using qualified, fresh deals and adjust coverage targets based on win rates and sales segments. |
| Set SMART targets | Transform KPIs into specific, measurable, achievable, relevant, and time-bound goals linked to clear sales activities. |
| Review regularly | Implement daily, weekly, and monthly KPI reviews to maintain accountability and enable timely course corrections. |
Let’s be honest: most sales dashboards are built for comfort, not clarity. Adding a metric feels productive. It signals diligence. But tracking too many metrics creates analysis paralysis instead of driving action. When everyone is watching everything, nobody is accountable for anything.
What are sales KPIs, really? They’re the specific, measurable signals that tell you whether your sales engine is healthy, growing, or quietly breaking down. The best ones don’t just reflect what happened. They help you predict what’s coming and course-correct before the quarter is lost.
Here’s the real talk on structure: a focused KPI set of 5 to 7 metrics aligned to your stage and goals outperforms a sprawling 20-metric dashboard every time. For tech companies with complex B2B sales cycles, that set should draw from three categories:
When choosing key sales metrics, the test is simple. Ask: does this metric directly connect to a business goal we care about this quarter? If the answer is “sort of” or “it’s good to know,” cut it. Structure beats heroics, and a clean KPI set gives your reps clarity and your managers something real to coach against.
You can’t set smart targets from guesses. Before you define a single KPI threshold, you need a solid baseline grounded in real historical data. This step is where most teams skip ahead and then wonder why their targets feel arbitrary to the reps who have to hit them.
Here’s how to build your baseline:
Here’s a simple baseline reference table to orient your analysis:
| Metric | What to measure | Healthy range (B2B SaaS, mid-market) |
|---|---|---|
| Win rate | Deals won ÷ deals entered | 20% to 30% |
| Pipeline coverage | Qualified pipeline ÷ quota | 3x to 4x |
| Sales cycle length | Days from qualified to closed | 45 to 90 days |
| Quota attainment | % of reps hitting 100%+ quota | 60% to 70% |
These aren’t universal laws. A product-led growth motion with shorter cycles will look very different from an enterprise field sales team. The point is to start with setting defensible sales targets grounded in your actual numbers, not aspirational guesses borrowed from a conference slide deck.
With clean baselines in hand, you’re ready to define your core KPIs and set benchmarks that mean something. We call the starting point the Starter Five. These are the five sales metrics for growth that every tech sales team should have on the board before adding anything else.
One of the best sales KPI examples for contextualizing pipeline targets is the coverage ratio by win rate. Pipeline coverage ratio equals qualified pipeline divided by quota, and your required coverage changes significantly based on your actual win rate:
| Win rate | Recommended pipeline coverage | Rationale |
|---|---|---|
| Below 15% | 6x to 8x | High slippage requires larger buffer |
| 15% to 25% | 4x to 5x | Standard enterprise buffer |
| 25% to 35% | 3x to 4x | Balanced mid-market coverage |
| Above 35% | 2.5x to 3x | Efficient conversion, lower buffer needed |
Using effective sales KPI frameworks means connecting these numbers to your specific motion, not applying a generic 3x rule across the board. A segment with a 15% win rate needs almost three times the pipeline of one with a 35% win rate. That’s a fact most target-setting conversations ignore.

Pro Tip: Always exclude stale deals (no activity in 45+ days, no defined next step) before calculating pipeline coverage. A pipeline loaded with zombie deals gives you false confidence right up until the last week of the quarter.
A KPI without a target is just a number. A target without math behind it is just a wish. The best sales KPI best practices connect outcomes to activities through explicit conversion logic, so every rep can see the line between what they do on Monday morning and whether the quarter gets closed.
Here’s how to do it in practice:
Pro Tip: Review your activity KPI math with your reps before locking targets. If they can see how the math works and believe the inputs are fair, buy-in goes up dramatically. Targets imposed from above without explanation breed resentment. Targets built transparently from shared data build ownership.
Setting targets is roughly 30% of the work. The other 70% is the cadence. Sales metrics for growth don’t generate themselves. They require consistent attention at the right frequency, with the right audience, and with a clear purpose for each review.
Here’s the structure we recommend:
One thing most teams get wrong: mixing health KPIs with improvement KPIs in the same dashboard. Health KPIs tell you if the engine is running. Improvement KPIs tell you if it’s running faster. When you review them together, teams game the health metrics to look good on the improvement metrics. Keep them in separate views.
Implementing KPI reviews as a formal cadence, not an ad hoc event, is what separates teams that course-correct early from teams that discover problems in the final week of the quarter.
Consistency and cadence build accountability and timely course correction. A great KPI set reviewed sporadically is worth less than a simpler set reviewed on a locked schedule every single week.
Here’s something we’ve seen repeatedly across European tech scale-ups: the KPI isn’t broken. The review isn’t happening. Sales leaders spend enormous energy designing the perfect KPI framework, then deprioritize the weekly pipeline review when things get busy. That’s the real failure mode.
The second pattern we see is what we call “metric hoarding.” Every new VP adds their preferred metrics to the stack. Nobody removes the old ones. Two years in, you have a CRM full of fields nobody fills in accurately and a dashboard nobody trusts. The best thing some teams could do is not set new KPIs but ruthlessly remove the ones that no longer connect to current strategy.
Real talk: the KPI conversation is actually a conversation about what your team believes matters. If your win rate metric exists but nobody reviews it in a 1:1, you’re telling your reps it doesn’t really matter. What gets scheduled KPI reviews and adjustments gets taken seriously. What gets ignored gets gamed or quietly abandoned.
Start smaller than you think you need to. Five focused KPIs reviewed with discipline will build more revenue predictability than fifteen metrics reviewed twice a year. That’s not a theory. That’s what we see in practice.
Setting the right sales KPIs is the first step. Getting your whole sales operation aligned behind them — with clean data, clear ownership, and consistent reviews — is where the real work lives. At Sales Label Consulting, we’ve helped RevOps leads, Heads of Sales, and VPs of Sales across European tech companies build exactly this kind of structure from scratch.
Whether you’re starting a sales audit, building your sales enablement foundation, or fixing a broken demand generation motion, we bring the experience and directness to help you get there without the guesswork. If you’re ready to move from “too many metrics, not enough clarity” to a system that drives predictable results, explore our consulting services and let’s talk about what your team actually needs.
Start with 5 to 7 core KPIs that directly align with your strategic goals. Adding more metrics before you’ve built a review cadence around the basics just creates noise without accountability.
Pipeline coverage equals total qualified pipeline divided by your quota for the period. Always exclude stale deals and adjust your required coverage target based on your actual win rate and sales segment.
Run daily checks for execution metrics, weekly reviews for pipeline health and conversion drivers, and monthly analysis for outcome KPIs like ARR and quota attainment. Consistent cadence matters more than review depth.
SMART goals turn KPIs into time-bound targets connected to specific activities and owners. They remove ambiguity about what success looks like and make it easier to identify exactly where performance is breaking down.
Subscribe to our Insights: Expert productivity tips in your inbox
You'll receive 1-3 emails per month. Your data stays private, always.

CRO & Co-Founder with Sales Label Consulting

Watch our Sales Mates Podcast
Available
May 20, 2026 - 9 min read
Read article Read articleMay 18, 2026 - 8 min read
Read article Read articleMay 16, 2026 - 9 min read
Read article Read articleFix the System
Not Symptoms