
Sales data insights: Step-by-step guide to better decisions
TL;DR:
- European tech sales leaders recognize data is valuable but struggle to turn numbers into strategic insights. Proper data cleaning, integration, and a structured analysis process are essential for accurate forecasts and pipeline optimization. Using insights to drive targeted actions and maintaining disciplined review cycles lead to measurable sales performance improvements.
Sales leaders in European tech companies are sitting on a goldmine, and most of them know it. The problem isn’t the data. It’s the gap between raw numbers and the strategic clarity needed to act on them with confidence. Your CRM is full, your dashboards are busy, and your forecast still feels like a guess. That ends here. This guide walks you through a practical, no-nonsense process for analyzing sales data so you can sharpen your forecasts, optimize your pipeline, and make decisions that actually move the needle. No fluff, no generic templates. Just what works.
| Point | Details |
|---|---|
| Start with clean data | Data quality is the foundation for all effective sales analysis and decisions. |
| Follow a repeatable process | A step-by-step method delivers more reliable insights and forecasts. |
| Avoid common mistakes | Check for outliers, context, and validation to keep analysis credible. |
| Act on your findings | Apply insights to strategy and forecasting for real impact in your sales results. |
Sales data analysis is the structured process of collecting, organizing, and interpreting data from your sales activities to identify patterns, measure performance, and guide strategic decisions. It’s not just about pulling a report. It’s about building a feedback loop that makes your entire sales operation smarter over time.
The benefits are real and measurable. When done right, analysis improves forecast accuracy, surfaces pipeline bottlenecks before they cost you deals, and helps you allocate resources where they’ll generate the most return. For European tech firms competing in fast-moving B2B markets, this isn’t optional. It’s a competitive necessity.
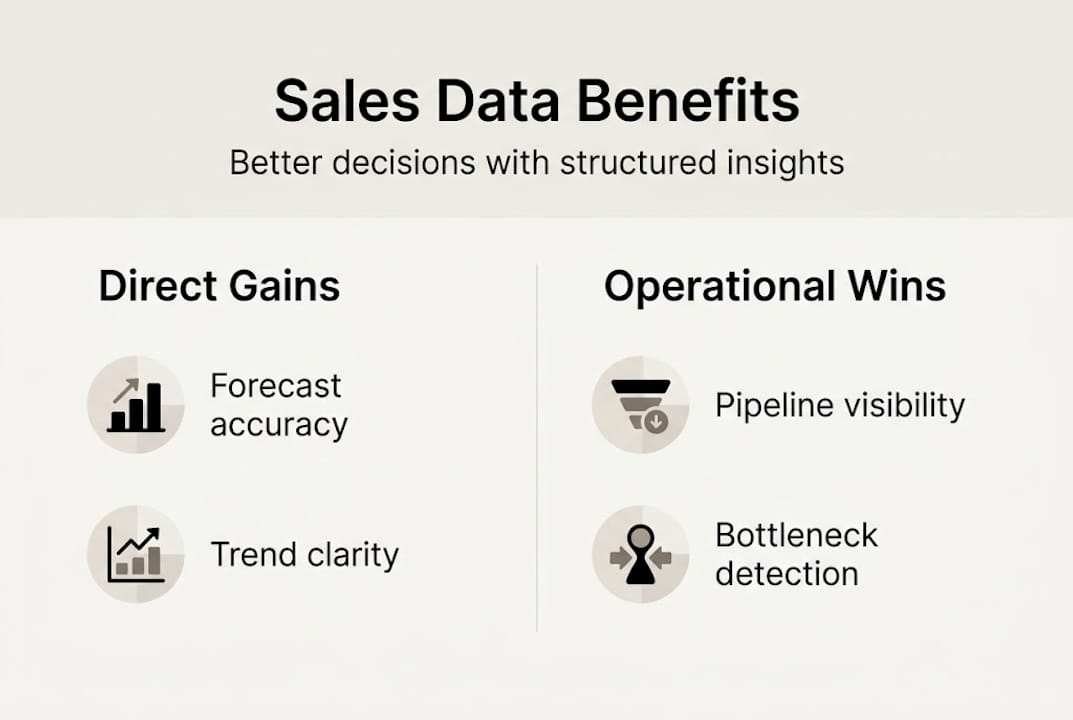
Data-driven sales teams outperform peers in both forecast accuracy and revenue growth. That’s not a coincidence. It’s the result of building systems that turn information into action.
Your data sources matter too. The most reliable analysis pulls from multiple inputs:
The companies investing in advanced analytics in B2B sales are pulling ahead. Combining these sources gives you a 360-degree view that no single tool can provide alone.
| Data source | Primary value | Common gap |
|---|---|---|
| CRM | Pipeline visibility | Incomplete entry |
| ERP | Revenue accuracy | Siloed from sales |
| Dashboards | Real-time tracking | Vanity metrics |
| Market feeds | External context | Rarely integrated |
For teams looking to build a stronger foundation, accurate sales trend analysis is a great starting point before you scale your analysis process.
With the benefits of analysis clear, let’s prepare your sales data for trustworthy results. Because here’s the truth: garbage in, garbage out. Even the best analysis framework falls apart if your underlying data is messy.
Clean data predicts successful analysis outcomes more reliably than any tool or methodology. Start there.
Data cleaning means three things in practice:
Integration is the next layer. Pulling data from your CRM, ERP, and external sources into a single environment gives you the holistic view that one-dimensional reporting can’t. Look at data integration tools that connect your stack without requiring a full IT overhaul.

Tool comparison at a glance:
| Tool | Best for | Limitation |
|---|---|---|
| Excel | Quick ad hoc analysis | Doesn’t scale well |
| Power BI / Tableau | Visual dashboards | Requires clean input |
| CRM analytics modules | Native pipeline data | Limited cross-source view |
A practical data prep workflow looks like this: assign a data owner per system, run weekly deduplication checks, validate field completeness monthly, and document your naming conventions in a shared reference guide. Use your performance review checklist to keep data hygiene tied to your regular performance review processes for teams.
Pro Tip: Automate routine cleaning tasks using your CRM’s workflow rules or a dedicated ETL tool. Even saving two hours a week per analyst compounds into significant capacity over a quarter.
With your data prepared, it’s time to dive into the actionable steps that turn numbers into strategy. A defined analysis process increases velocity and accuracy in sales forecasting. Here’s how to run it.
For teams still building their analysis muscle, assessing sales performance systematically is a prerequisite. And if you need inspiration on how to act on findings, sales strategy examples show how leading teams translate data into execution.
The data analytics and sales performance connection is well documented. The teams that follow a repeatable process consistently outperform those that run ad hoc analysis.
Pro Tip: Build a one-page analysis brief for each cycle. It forces clarity on objectives and makes it easier to communicate findings upward without a 40-slide deck.
Even with a robust process, certain missteps can undermine your efforts. Here’s what to watch for, and how to stay on track.
Ignoring outliers and failing to validate leads to unreliable forecasts. That’s not a minor inconvenience. It’s a strategic liability.
The most common pitfalls we see:
For outlier handling: flag them, investigate them, and decide deliberately whether to include or exclude them. Document your reasoning. For missing data: impute where statistically sound, exclude where it’s not, and always note the gap in your findings.
Real talk: The most dangerous analysis is the one that looks polished but is built on unvalidated assumptions. Always pressure-test your conclusions before presenting them.
Pro Tip: Have another sales leader or your RevOps lead review your analysis before you present it. A second set of eyes catches assumptions you’ve stopped questioning.
If you’re redesigning incentive structures based on your findings, make sure your sales commission model guide is aligned with what the data actually supports. And review common mistakes in data analysis to build your internal QA checklist.
Once you’ve completed your analysis, the final step is driving real business value from your newfound insights. This is where most teams drop the ball. They do the analysis, write the report, and then… nothing changes.
Companies acting on sales data insights see up to 30% improvement in forecasting accuracy. That number only materializes if you close the loop between insight and action.
Here’s how to do it:
| Action type | Timeframe | Owner |
|---|---|---|
| Pipeline adjustments | Immediate | Sales manager |
| Forecast model updates | Monthly | RevOps |
| Strategy pivots | Quarterly | VP of Sales |
| ICP refinement | Bi-annual | Sales and marketing |
For teams working on improving forecast accuracy long-term, the cadence matters as much as the methodology. And if you’re ready to scale this into a full transformation, explore what data-driven sales transformation looks like in practice.
Pro Tip: Assign a named owner to every insight that requires action. Insights without owners become slide decks that nobody reads.
For more on translating data into B2B growth, using data for B2B sales improvements offers practical frameworks worth benchmarking against.
Looking back on the steps, let’s address why so many guides miss the mark. And how you can get it right.
Most guides treat sales data analysis like a universal recipe. Copy the template, plug in your numbers, get your answer. That approach fails European tech teams almost every time. Why? Because the EU market has regulatory nuances, cultural buying patterns, and organizational structures that generic playbooks simply don’t account for.
Real talk: quantitative analysis without qualitative judgment is just math. The best sales leaders we work with don’t just read the numbers. They interrogate them. They ask why a metric moved, not just that it moved. They factor in what a rep told them in a pipeline call, what a customer said in a renewal conversation, and what’s happening in the competitive landscape.
The teams that get this right do three things differently. They pilot-test new analysis frameworks on one region or segment before rolling out company-wide. They build peer review into the process, not as a formality but as a genuine check on assumptions. And they create feedback loops where frontline reps can flag data quality issues in real time.
Structure beats heroics here. You don’t need a data science team. You need a disciplined process and the right winning sales operation activities to support it.
You’ve got the framework. Now it’s about execution at scale. That’s where most teams need a partner who’s been in the trenches of European tech sales and knows what actually works beyond the theory.
At Sales Label Consulting, we work directly with RevOps leaders, Heads of Sales, and VPs to design data analysis systems that produce reliable forecasts and smarter decisions. From boosting ROI with sales enablement metrics to building predictable revenue strategies that hold up under scrutiny, our consulting practice is built for tech companies that are serious about getting this right. Let’s turn your data into your biggest competitive advantage.
Key metrics include win rate, sales velocity, average deal size, customer acquisition cost, and pipeline coverage. Tracking core sales metrics consistently is what separates teams that improve from those that plateau.
Perform sales data analysis monthly for tactical team reviews, with a deeper quarterly cycle for strategic planning. Regular analysis boosts adaptability and keeps your forecast models calibrated to current market conditions.
Missing data, inconsistent field formats, and duplicate entries are the most frequent culprits. Preparation mistakes cause analysis failure more often than any methodology gap.
Align your forecast models to the trends your data actually surfaces, not the targets you wish were true. Data-driven actions improve accuracy significantly when insights are tied to specific process changes with named owners.
Salesforce Analytics, Microsoft Power BI, and Tableau are top choices for tech-focused sales teams. BI platforms support sales analysis at scale when integrated with clean, validated source data.
Subscribe to our Insights: Expert productivity tips in your inbox
You'll receive 1-3 emails per month. Your data stays private, always.

CRO & Co-Founder with Sales Label Consulting

Watch our Sales Mates Podcast
Available
June 11, 2026 - 9 min read
Read article Read articleJune 10, 2026 - 16 min read
Read article Read articleJune 9, 2026 - 9 min read
Read article Read articleFix the System
Not Symptoms