
How to Assess Sales Performance: 15-25% EBITDA Growth Guide
Sales leaders often face incomplete visibility into their team’s true effectiveness. Fragmented metrics and subjective impressions obscure growth opportunities and undermine forecast accuracy. Companies adopting data-driven sales approaches see EBITDA gains up to 25%. This guide delivers a structured, RevOps-enabled assessment framework that transforms revenue predictability and drives measurable growth for EU technology firms.
| Point | Details |
|---|---|
| Holistic Assessment | Sales performance assessment combines quantitative metrics with qualitative insights for complete visibility. |
| RevOps Integration | RevOps unifies data across revenue teams, improving forecast accuracy by up to 30%. |
| SMART Goals | Specific, measurable goals enhance accountability and focus sales efforts effectively. |
| Data-Driven Coaching | Coaching based on assessment data boosts sales effectiveness by 20%. |
| Avoid Common Pitfalls | Poor data hygiene and subjective bias undermine assessment accuracy and growth potential. |
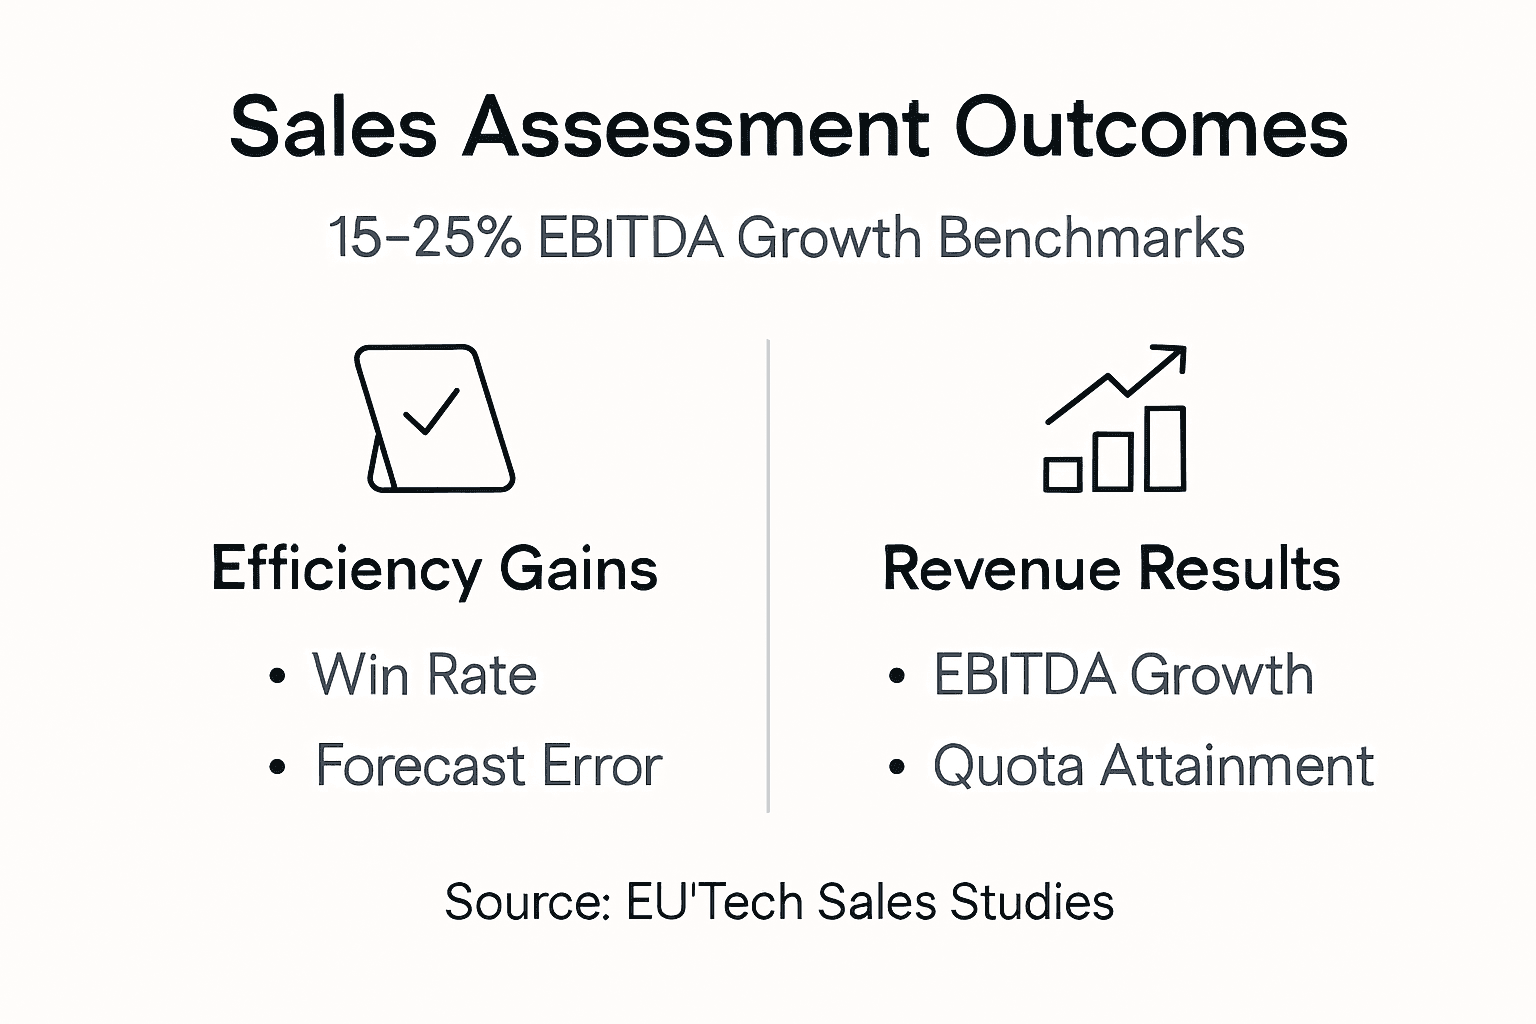
Structured sales performance assessment drives predictable revenue and measurable business impact. Data-driven sales assessment correlates with 15-25% EBITDA gains in B2B firms, directly impacting your bottom line. Technology sector sales present unique complexity with long cycles, multiple stakeholders, and evolving buyer expectations.
Fragmented evaluation methods create blind spots. Missed growth opportunities and forecast errors cost revenue and erode stakeholder confidence. Without unified visibility into effective sales departments, leaders struggle to allocate resources optimally or identify coaching priorities.
Effective assessment supports critical functions:
RevOps adoption is rising to address these challenges. EU technology firms increasingly recognize that breaking down silos between sales, marketing, and customer success creates the unified data foundation required for accurate performance evaluation and sustainable growth.
Successful assessment requires foundational elements in place before you begin. Without these building blocks, your evaluation risks inaccuracy and produces insights you cannot act on effectively.
Your CRM system must contain clean, integrated data. Reliable sales records, pipeline information, and activity tracking form the backbone of quantitative analysis. Garbage in means garbage out.
Establish an established RevOps function or cross-functional collaboration framework. Sales does not operate in isolation. Marketing generates leads, customer success impacts retention, and finance tracks profitability. These teams must coordinate.
Essential prerequisites include:
Pro Tip: Run a data audit before starting your assessment. Identify missing fields, duplicate records, and inconsistent data entry. Clean data now saves weeks of confusion later and ensures your insights reflect reality.
Secure executive sponsorship. Assessment without action wastes time. Leaders must commit to acting on findings, whether that means coaching investments, process changes, or difficult personnel decisions.
RevOps integration transforms sales assessment from isolated analysis to comprehensive revenue intelligence. Traditional approaches evaluate sales in a vacuum, missing critical context from marketing pipeline contribution and customer success retention patterns.
RevOps aligns sales, marketing, customer success, and finance around unified goals and shared data. This removes operational silos that fragment your view of revenue performance. Instead of three different spreadsheets with conflicting numbers, you gain a single source of truth.
RevOps eliminates silos and improves revenue predictability. 75% of high-growth firms will adopt RevOps by 2026, recognizing its impact on forecast accuracy, which improves by up to 30% when revenue teams coordinate effectively.
A RevOps-enabled sales team structure delivers specific assessment advantages:
Pro Tip: Start small with RevOps integration. Pick one cross-functional metric like lead-to-opportunity conversion rate. Get sales and marketing aligned on measurement and targets. Build from there rather than attempting wholesale organizational transformation overnight.
Implement regular revenue meetings where sales, marketing, and customer success review shared dashboards. This habit creates accountability and ensures assessment insights translate into coordinated action across your revenue organization.
Metrics selection determines what you can see and improve. Choose poorly and you optimize for vanity numbers while missing performance drivers. Choose wisely and you gain actionable intelligence.
Identify core quantitative metrics that matter for your business model. Pipeline velocity measures how quickly deals progress. Win rate shows conversion effectiveness. Sales cycle length reveals efficiency. Cost per acquisition (CAC) tracks investment required to land new customers.
Metrics like pipeline velocity, win rates, sales cycle time, and CAC provide comprehensive sales efficiency measurement. These indicators connect directly to revenue outcomes and business profitability.
Include activity metrics to understand effort levels. Calls made, meetings held, proposals sent reveal whether reps execute sufficient volume. Low activity often predicts pipeline problems before they appear in lagging indicators.
Customer lifetime value (LTV) and acquisition metrics inform revenue quality. Landing customers who churn quickly or require excessive support costs more than they return. Track both acquisition and retention to assess true performance.
| Metric | Definition | Relevance |
|---|---|---|
| Pipeline Velocity | Speed deals move through stages | Predicts revenue timing and identifies bottlenecks |
| Win Rate | Percentage of opportunities closed won | Measures qualification and execution effectiveness |
| Sales Cycle Length | Average days from opportunity to close | Indicates efficiency and forecasting accuracy |
| CAC | Cost to acquire one new customer | Determines profitability and scaling viability |
| Activity Volume | Calls, meetings, proposals per rep | Shows effort levels and leading indicators |
Set up reliable data collection within your CRM and build dashboards that surface these metrics automatically. Manual reporting consumes time and introduces errors. Automation ensures consistency and frees managers to analyze rather than compile.

Align metric choice with organizational goals. A startup prioritizing growth tracks different indicators than a mature firm optimizing margin. Your key sales enablement metrics must reflect what success means for your specific situation and growth stage.
Numbers tell part of the story. They reveal what happened but often miss why it happened and how to improve it. Quantitative data alone overlooks nuances like customer feedback, relationship quality, and behavioral patterns.
Incorporate behavioral evaluations and structured feedback. How do reps handle objections? Do they listen actively or talk over prospects? Can they articulate value propositions clearly? These skills drive outcomes but rarely appear in dashboards.
Structured evaluations combining quantitative data and qualitative insights improve win rates compared to random, subjective assessments. The combination creates a complete picture that purely numeric analysis cannot provide.
Avoid over-reliance on subjective impressions. Manager opinions matter but introduce bias when used without data support. A rep you personally like may underperform metrics. One you find difficult may deliver exceptional results. Balance perception with evidence.
Balanced assessment components include:
Pro Tip: Create a simple scoring rubric for qualitative factors like communication skills, product knowledge, and objection handling. Rate each on a 1-5 scale with clear definitions for each level. This adds structure to subjective evaluation and reduces bias.
Use combined insights to tailor coaching. A rep with strong activity but low win rate needs deal execution coaching, not motivation. One with high win rate but insufficient pipeline needs prospecting support. Structured sales evaluations reveal these distinctions clearly.
Vague goals produce vague results. Telling a rep to “do better” or “increase revenue” provides no roadmap. SMART criteria create clarity and accountability that drive measurable improvement.
SMART stands for Specific, Measurable, Achievable, Relevant, and Time-bound. Each element serves a purpose. Specific defines exactly what success looks like. Measurable enables tracking. Achievable prevents demotivation from impossible targets. Relevant connects to business priorities. Time-bound creates urgency.
SMART goals accelerate measurable sales improvements by improving focus and accountability. They transform abstract aspirations into concrete actions with clear success criteria.
Examples of SMART sales goals:
Align goals with overall business strategy and individual roles. A junior rep closing small deals needs different targets than a senior enterprise seller. Territory characteristics matter. Adjust for market maturity, competition, and available resources.
Regularly review progress and adjust goals as needed. Markets shift. Priorities change. Rigid adherence to outdated targets wastes effort. Schedule monthly check-ins to assess whether goals remain relevant and achievable.
SMART goal setting in sales performance reviews creates transparency. Reps understand exactly what you expect. You gain objective criteria for evaluation. Ambiguity disappears, replaced by shared understanding of success.
Assessment without action wastes time. Data reveals gaps. Coaching closes them. Tailored coaching based on performance assessment can increase sales effectiveness by 20%, translating directly to revenue growth.
Use assessment data to identify individual skill gaps and development needs. Does a rep struggle with discovery calls? Technical objections? Closing? Pinpoint the specific weakness rather than generic “needs improvement” feedback.
Create personalized coaching plans targeting those gaps:
Align incentive programs to support sustainable behavior changes. If you want better discovery, reward thorough needs analysis, not just deal velocity. Compensation drives behavior. Ensure it reinforces what assessment reveals you need.
Pro Tip: Record coaching sessions and revisit them in follow-up meetings. Reps often forget specific guidance. Reviewing the recording reinforces key points and demonstrates your investment in their development.
Establish regular feedback loops for continuous improvement. Monthly one-on-ones should review metrics, discuss challenges, and adjust development plans. Coaching is not a one-time event but an ongoing process.
Our sales team coaching tips provide additional frameworks for implementing effective development programs that drive measurable results and build high-performing teams.
Even well-intentioned assessments fail when common pitfalls go unaddressed. Awareness helps you avoid these traps.
Avoid relying solely on sales manager impressions without data support. Over-reliance on subjective judgment and poor CRM data cause forecast errors and blind spots. What feels true may not match reality. Verify opinions with evidence.
Maintain CRM data hygiene rigorously. Incomplete or inaccurate data produces unreliable insights. Poor data quality causes forecast errors up to 30%, undermining confidence in your assessment and subsequent decisions.
Track pipeline health metrics, not just closed deals. Ignoring pipeline health metrics and incentive alignment reduces sales growth opportunities. Lagging indicators show what happened. Leading indicators predict what will happen. You need both.
Common assessment mistakes include:
Ensure incentive programs align with desired sales behaviors. Paying for volume when you need quality produces the wrong outcomes. Compensation structure must reinforce assessment priorities.
Conduct periodic reviews to spot and fix blind spots early. Schedule quarterly assessment audits where you examine your evaluation process itself. Are you measuring what matters? Acting on findings? Improving outcomes? Continuous improvement applies to assessment too.
Our guide on common sales assessment mistakes explores these pitfalls in detail and provides actionable strategies for building more effective evaluation processes.
Structured assessment delivers measurable improvements when implemented consistently. Understanding realistic benchmarks helps set appropriate expectations and maintain commitment through the implementation period.
Data-driven sales performance strategies yield 15-25% EBITDA gains and cut forecast errors by 30%. These improvements compound over time as refined processes and skilled reps generate consistent results.
Sales coaching increases effectiveness by 20% when guided by assessment insights. Targeted development addresses actual gaps rather than generic training, maximizing return on coaching investment.
Quota attainment rates improve significantly. More reps hit targets when assessment identifies obstacles and coaching removes them. Pipeline conversion rates climb as qualification and execution skills strengthen.
Measurable outcomes typically materialize within one to two sales cycles. Immediate improvements appear in activity metrics and pipeline health. Revenue impact follows as deals progress through improved processes.
| Outcome | Typical Improvement | Timeline |
|---|---|---|
| EBITDA Growth | 15-25% increase | 2-4 quarters |
| Forecast Accuracy | 30% error reduction | 1-2 quarters |
| Sales Effectiveness | 20% improvement | 2-3 quarters |
| Quota Attainment | 15-20% more reps hitting targets | 1-2 quarters |
| Win Rate | 10-15% increase | 2-3 quarters |
These benchmarks assume consistent implementation and adequate resources. Partial efforts produce partial results. Leadership commitment and follow-through determine whether potential becomes reality.
Track progress against these benchmarks through your chosen metrics. Celebrate wins to maintain momentum. Address gaps quickly when results lag expectations. Our resources on sales performance benchmarks provide additional context for evaluating your progress.
Transforming sales performance requires expertise and proven frameworks. Our tailored sales enablement services help you build predictable revenue streams through structured assessment and targeted development programs.
We guide you through implementing RevOps structures that unify your revenue teams for better insights and coordinated execution. Our sales enablement step-by-step guide walks you through each phase with clear milestones and deliverables.
Leverage our extensive entrepreneurial tech experience to scale your sales performance confidently. We have built and optimized sales departments across EU technology firms, delivering measurable results through data-driven approaches.
Explore our RevOps sales team structure insights to understand how aligned revenue organizations outperform traditional siloed approaches. Discover best practices for sales enablement that drive sustainable growth.
Pipeline health reveals future revenue predictability and identifies risks before they impact results. A large pipeline with stalled deals or poor qualification signals problems that total value masks. Healthy pipeline velocity, stage distribution, and deal quality predict consistent performance.
Quarterly formal assessments provide sufficient frequency for meaningful trends without overwhelming teams. Monthly informal check-ins on key metrics enable faster course correction. Annual reviews occur too infrequently to address issues promptly or capitalize on opportunities.
CRM systems provide data foundation and automate metric tracking. Analytics platforms surface trends and anomalies. Call recording tools enable qualitative evaluation. Integration creates seamless workflows where data flows automatically rather than requiring manual compilation and reporting.
Use quantitative metrics to identify what needs improvement and qualitative assessment to understand why gaps exist. Numbers reveal underperformance, but observation and feedback explain root causes. Combined insights enable targeted coaching that addresses actual obstacles rather than symptoms.
Run a comprehensive data audit identifying missing fields, duplicates, and inconsistencies. Implement data entry standards and provide training on proper CRM usage. Clean historical data where feasible. Establish ongoing data hygiene processes to prevent future degradation that undermines assessment accuracy.
Subscribe to our Insights: Expert productivity tips in your inbox
You'll receive 1-3 emails per month. Your data stays private, always.

CRO & Co-Founder with Sales Label Consulting

Lets book a consultation call
July 19, 2026 - 9 min read
Read article Read articleJuly 16, 2026 - 9 min read
Read article Read article