
MQL to SQL Conversion: Benchmarks and a Playbook to Fix It
MQL to SQL conversion measures the percentage of marketing qualified leads that sales accepts as sales qualified: divide SQLs by MQLs and multiply by 100. A conservative benchmark band is roughly 13% to 31%, depending heavily on deal size and sales cycle, according to MarketerHire’s benchmark data. If your number sits below that range, the fastest fix isn’t more leads. It’s agreeing on an SLA with sales and measuring conversion by source starting this week.
A stable, improvable MQL to SQL conversion rate depends on a shared SLA, fit-and-intent lead scoring, fast routing, and mandatory rejection reasons feeding a recycling loop.
| Point | Details |
|---|---|
| Standardize the formula | Use (SQLs ÷ MQLs) × 100 with a consistent backward-counting window each quarter. |
| Benchmark by model | Expect 13% to 31% depending on deal size, cycle length, and channel mix. |
| Fix alignment before scoring | Co-create an SLA with sales before investing in predictive scoring models. |
| Score fit and intent separately | Multiply the two axes so high fit alone can’t pass a zero-intent lead. |
| Mandate rejection reasons | Require a reason field on every rejected MQL to build a real feedback loop. |
The math is simple. The counting rules are where teams get it wrong.
Here’s the formula, broken into the parts that actually trip people up:
A marketing qualified lead shows engagement signals (content downloads, webinar attendance, fit criteria). A sales qualified lead has been vetted by sales as ready for outreach, per Salesforce’s definitions. Mixing up which team owns which label is the single most common measurement error we see.
Pro Tip: Pick your counting window and stick with it for at least two full quarters. Changing the window mid-analysis makes every month-over-month comparison meaningless.
Stop chasing one universal number. The right benchmark depends entirely on your business model, and pretending otherwise sets teams up to celebrate mediocrity or panic over healthy numbers.
Broadly, MQL→SQL conversion rates vary widely, with B2B SaaS often seeing relatively lower rates in typical ranges. Here’s how that shifts by model:
Channel matters as much as model. Organic and referral traffic converts two to three times higher than paid traffic in most benchmarking data, so a blended company-wide number can hide a paid channel that’s quietly wasting budget. Benchmark by channel and by ICP cohort, not just company-wide. A single average rate flattens the real story.
Most low conversion rates trace back to one of five root causes, and they’re almost all fixable without hiring anyone new.
Each of these is diagnosable in an afternoon by pulling your last 100 rejected MQLs and sorting by cause.
Run two reporting cadences: a monthly tactical view for catching problems fast, and a quarterly strategic view for spotting trends and reallocating budget. Use a backward-window count in both so handoff lag doesn’t distort the numbers.
Segment every report the same four ways:
Your dashboard needs a few fields to be genuinely useful for diagnosing problems, not just tracking a vanity metric:
| Dashboard Field | Why It Matters |
|---|---|
| Conversion % by source | Reveals which channels are wasting spend |
| Time-to-acceptance (velocity) | Flags routing or follow-up delays |
| Rejection reason (mandatory) | Feeds the feedback loop back to marketing |
| Recycle rate | Shows how many rejected leads later convert |
| Score band trendline | Confirms the scoring model still predicts outcomes |
Add these as native CRM fields rather than a side spreadsheet, and most platforms can automate the pull into a weekly or monthly report.
Fix these in order. Skipping the SLA to jump straight to fancier scoring is the most common mistake we see, and it wastes the scoring investment.
1. Co-create the SLA first. Get marketing and sales in a room and define acceptance criteria, rejection criteria, ownership of each stage, and a response time commitment (24 hours is a common standard). A co-created SLA with mandatory rejection reasons is the foundation everything else builds on. Without it, every other fix sits on sand.

2. Fix lead scoring: separate fit from intent. Score firmographic fit (company size, industry, role) on one axis and behavioral intent (page visits, content consumed, demo requests) on a second axis, then multiply them. That way a perfect-fit lead with zero engagement can’t sneak through, per Clay’s lead scoring methodology. Validate the model quarterly by replaying it against closed-won history. A healthy model shows hot leads converting around 18%, warm around 7%, and cold around 1.5%; if those bands look flat, the model’s broken.
3. Fix speed-to-lead and routing. Set rules for instant assignment of hot leads to available reps, and write the score directly into CRM fields reps already look at, since an unused score in a dashboard nobody opens helps no one. Our guide on lead routing rules covers the setup mechanics in detail.
4. Recycle rejected leads deliberately. Require a rejection reason on every single rejected MQL, then route different reasons into different nurture tracks. “Not ready” gets a drip campaign. “Wrong fit” gets removed from the list entirely.
Pro Tip: Run the SLA and scoring fixes in parallel, not sequentially. Waiting for “perfect” scoring before agreeing on an SLA just delays the bigger win.
Sales Label Consulting has run this exact sequence with B2B tech clients, and the pattern holds: fix alignment first, then scoring, then routing. Another produced two closed SQLs from targeted outreach within three months of tightening ICP criteria.
The first 90 days should focus on three things: audit your last 100 rejected MQLs and tag each by root cause, mandate a rejection-reason field in the CRM if one doesn’t exist, and reweight your scoring model based on what that audit reveals.
The single biggest lever most teams ignore isn’t a new tool. It’s forcing every rejected lead to carry a reason, because that one field turns guesswork into a feedback loop marketing can actually act on.
The industry loves quoting a single conversion percentage as if it means anything without context. It doesn’t. A 15% rate for an enterprise deal with a nine-month cycle is a different animal than 15% for a self-serve SaaS trial, and treating them as comparable is where most benchmarking advice goes wrong.
What the evidence actually supports is this: alignment beats optimization every time. Teams that skip the SLA and jump straight to predictive scoring models are optimizing a process that both sides still disagree on. That’s backward. Get sales and marketing to agree on what “qualified” means, in writing, with a required rejection reason on every rejected lead, before you touch the scoring model.
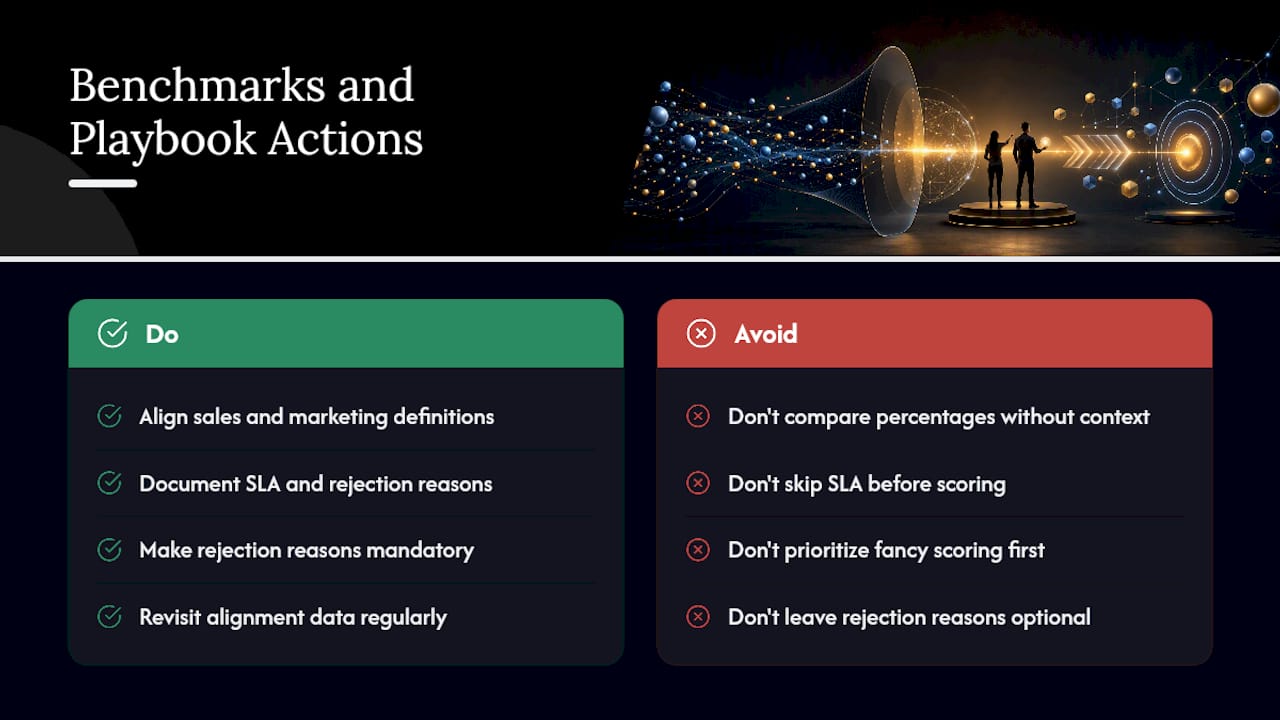
The most overrated fix in this space is a fancier scoring algorithm. The most underrated fix is a mandatory dropdown field. If you do only one thing after reading this, make rejection reasons non-optional in your CRM this week, and revisit sales and marketing alignment data to see why that shared accountability moves revenue, not just conversion percentages.
What’s the difference between an MQL and an SQL?
An MQL shows engagement signals that fit your target profile, like downloading a guide or attending a webinar. An SQL has been vetted by sales as ready for direct outreach, based on Salesforce’s qualification criteria.
What’s a good MQL to SQL conversion rate?
Somewhere between 13% and 31% is typical, with the right target depending on your deal size, sales cycle, and lead source. Chasing one flat industry number ignores how differently each business model performs.
How often should we review lead scoring?
Quarterly, at minimum. Replay the model against closed-won and closed-lost history each time to confirm hot leads still convert far more often than cold ones.
What should happen when sales rejects an MQL?
Sales should log a mandatory rejection reason, and that lead should route into a nurture track matched to the reason, not disappear into a dead list.
Do we need new software to fix low conversion?
Usually not. Most low conversion traces back to a missing SLA or absent rejection-reason field rather than a tooling gap. If you want outside eyes on the full setup, a sales process audit from Saleslabelconsulting can pinpoint exactly where the handoff breaks before you spend on new platforms.
Subscribe to our Insights: Expert productivity tips in your inbox
You'll receive 1-3 emails per month. Your data stays private, always.

CRO & Co-Founder with Sales Label Consulting

Watch our Sales Mates Podcast
October 15, 2026 - 9 min read
Read article Read articleOctober 14, 2026 - 7 min read
Read article Read articleOctober 13, 2026 - 10 min read
Read article Read articleOctober 12, 2026 - 11 min read
Read article Read article